

Each demo pairs the rendered result with a practical use case, the capability it proves, and the source and build path needed to reproduce it.
 Enlarge image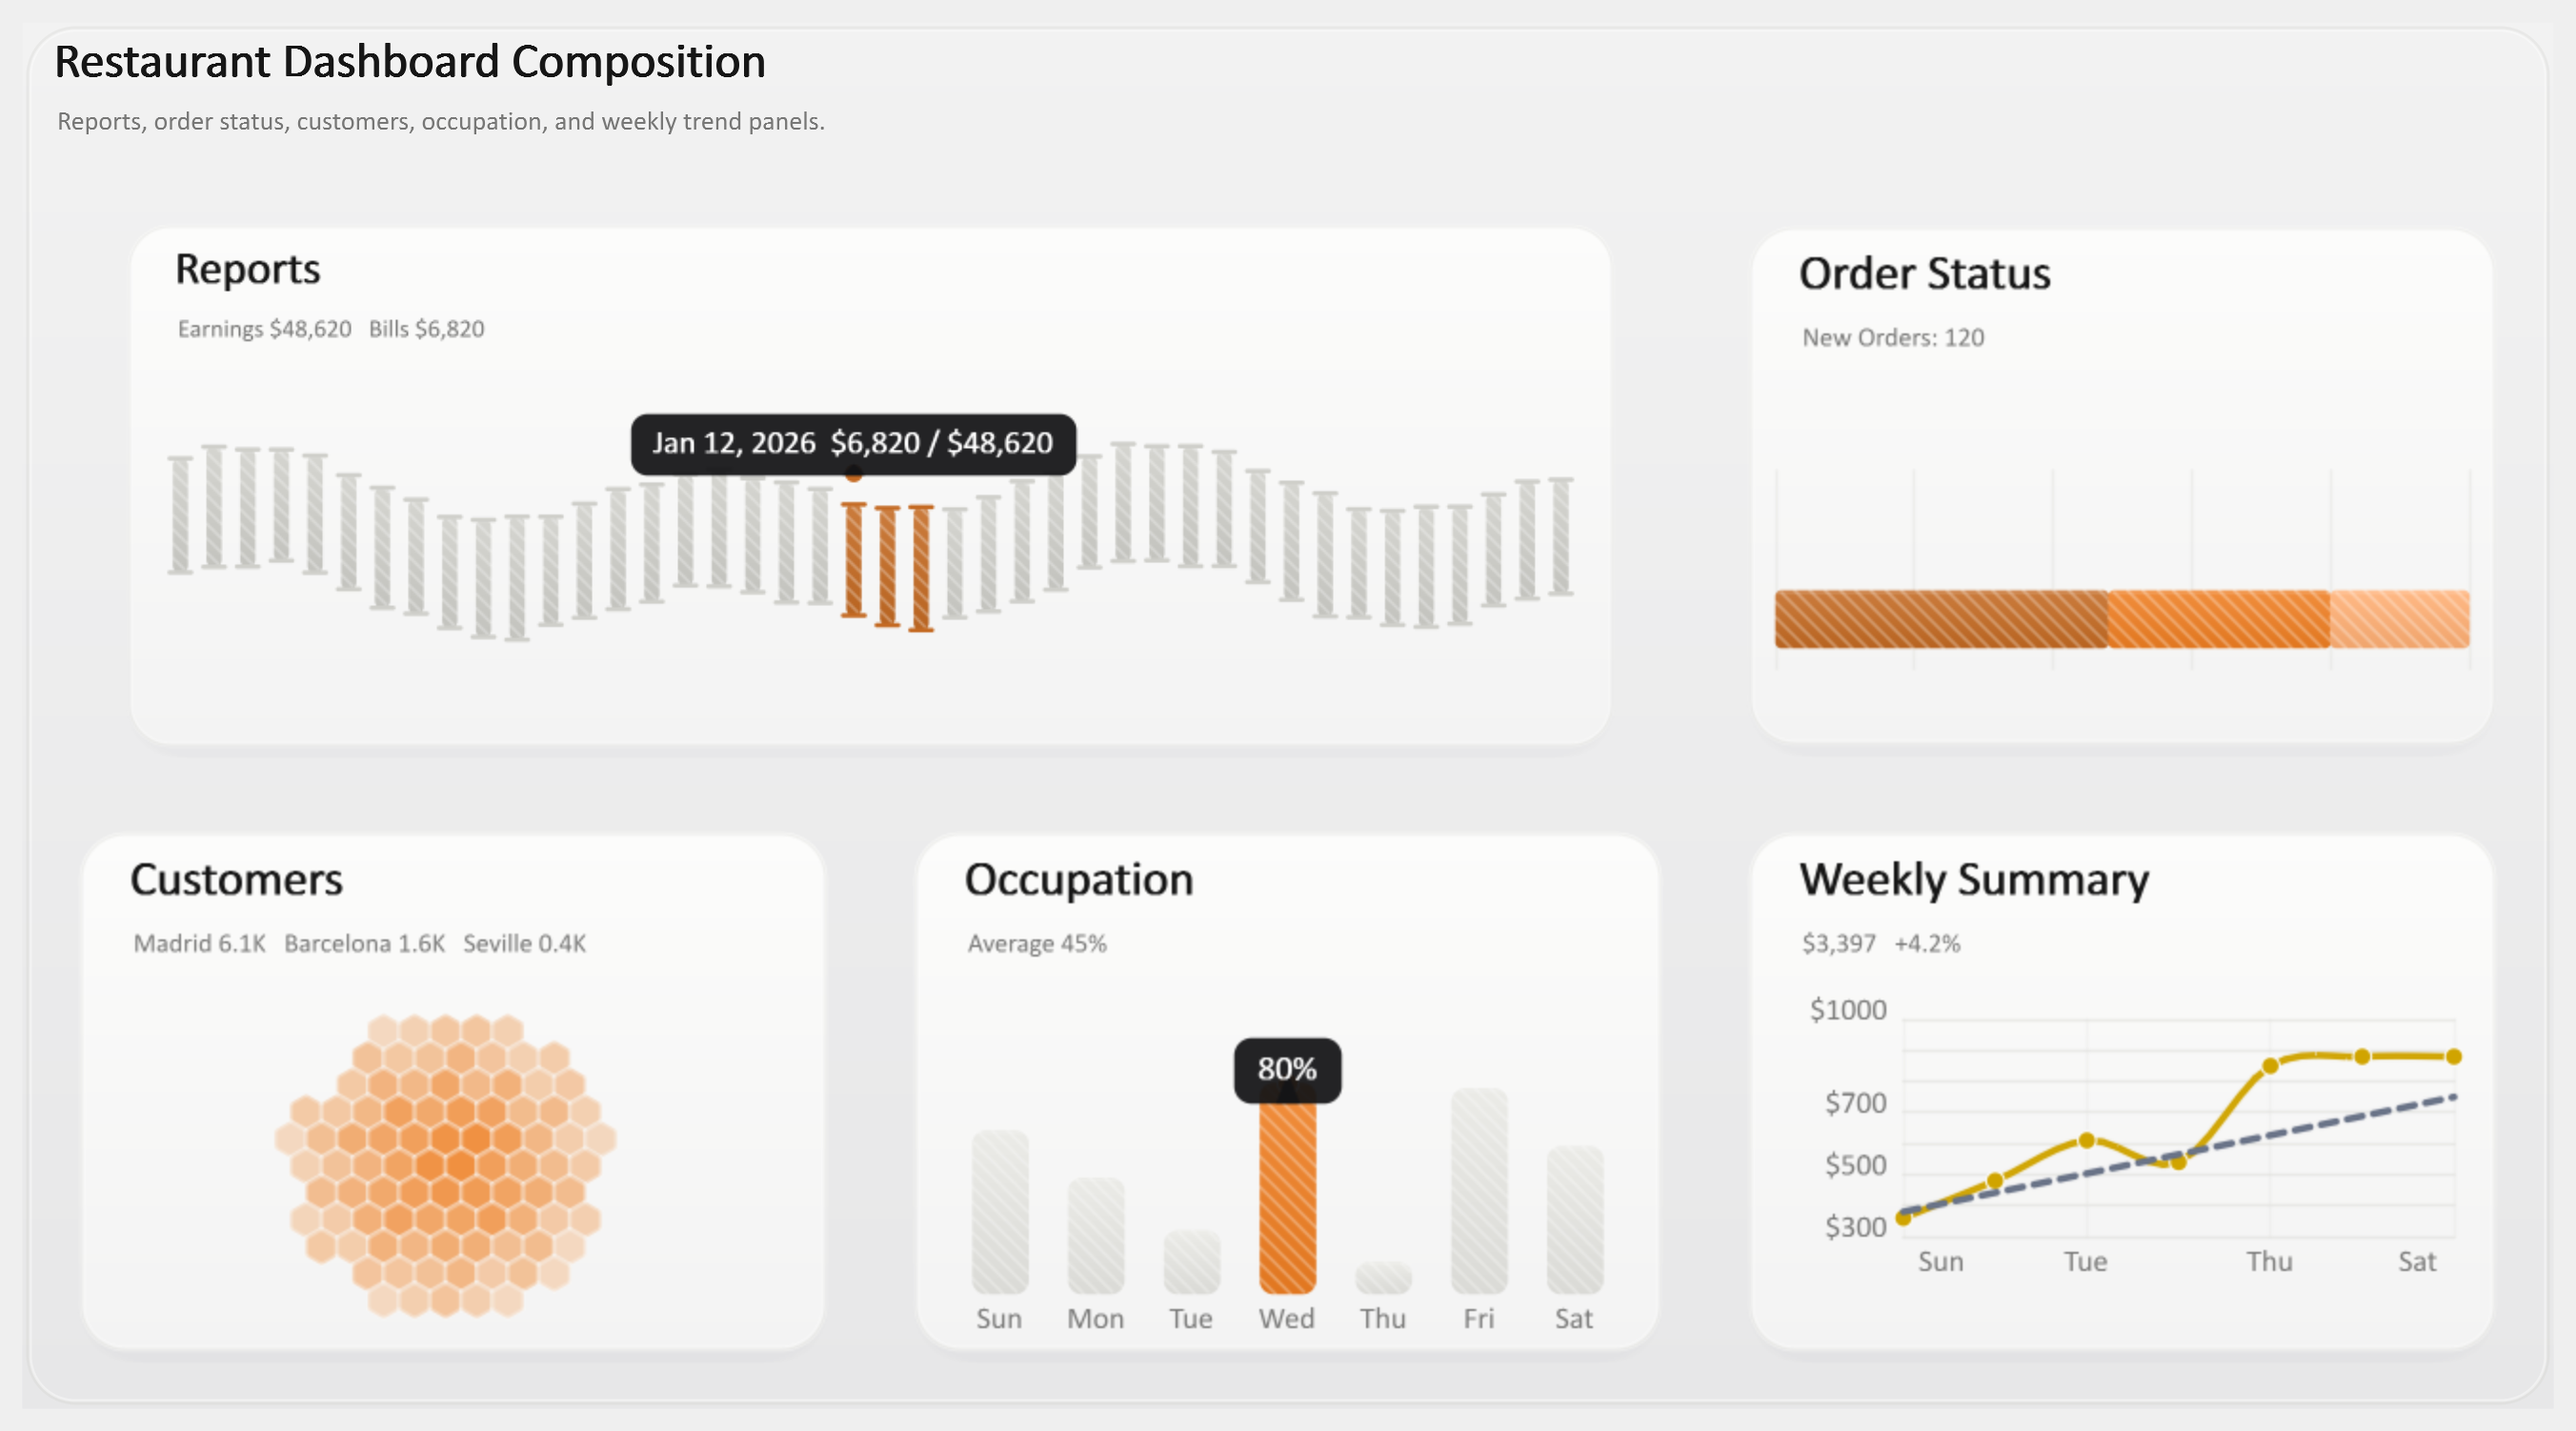
Dashboards
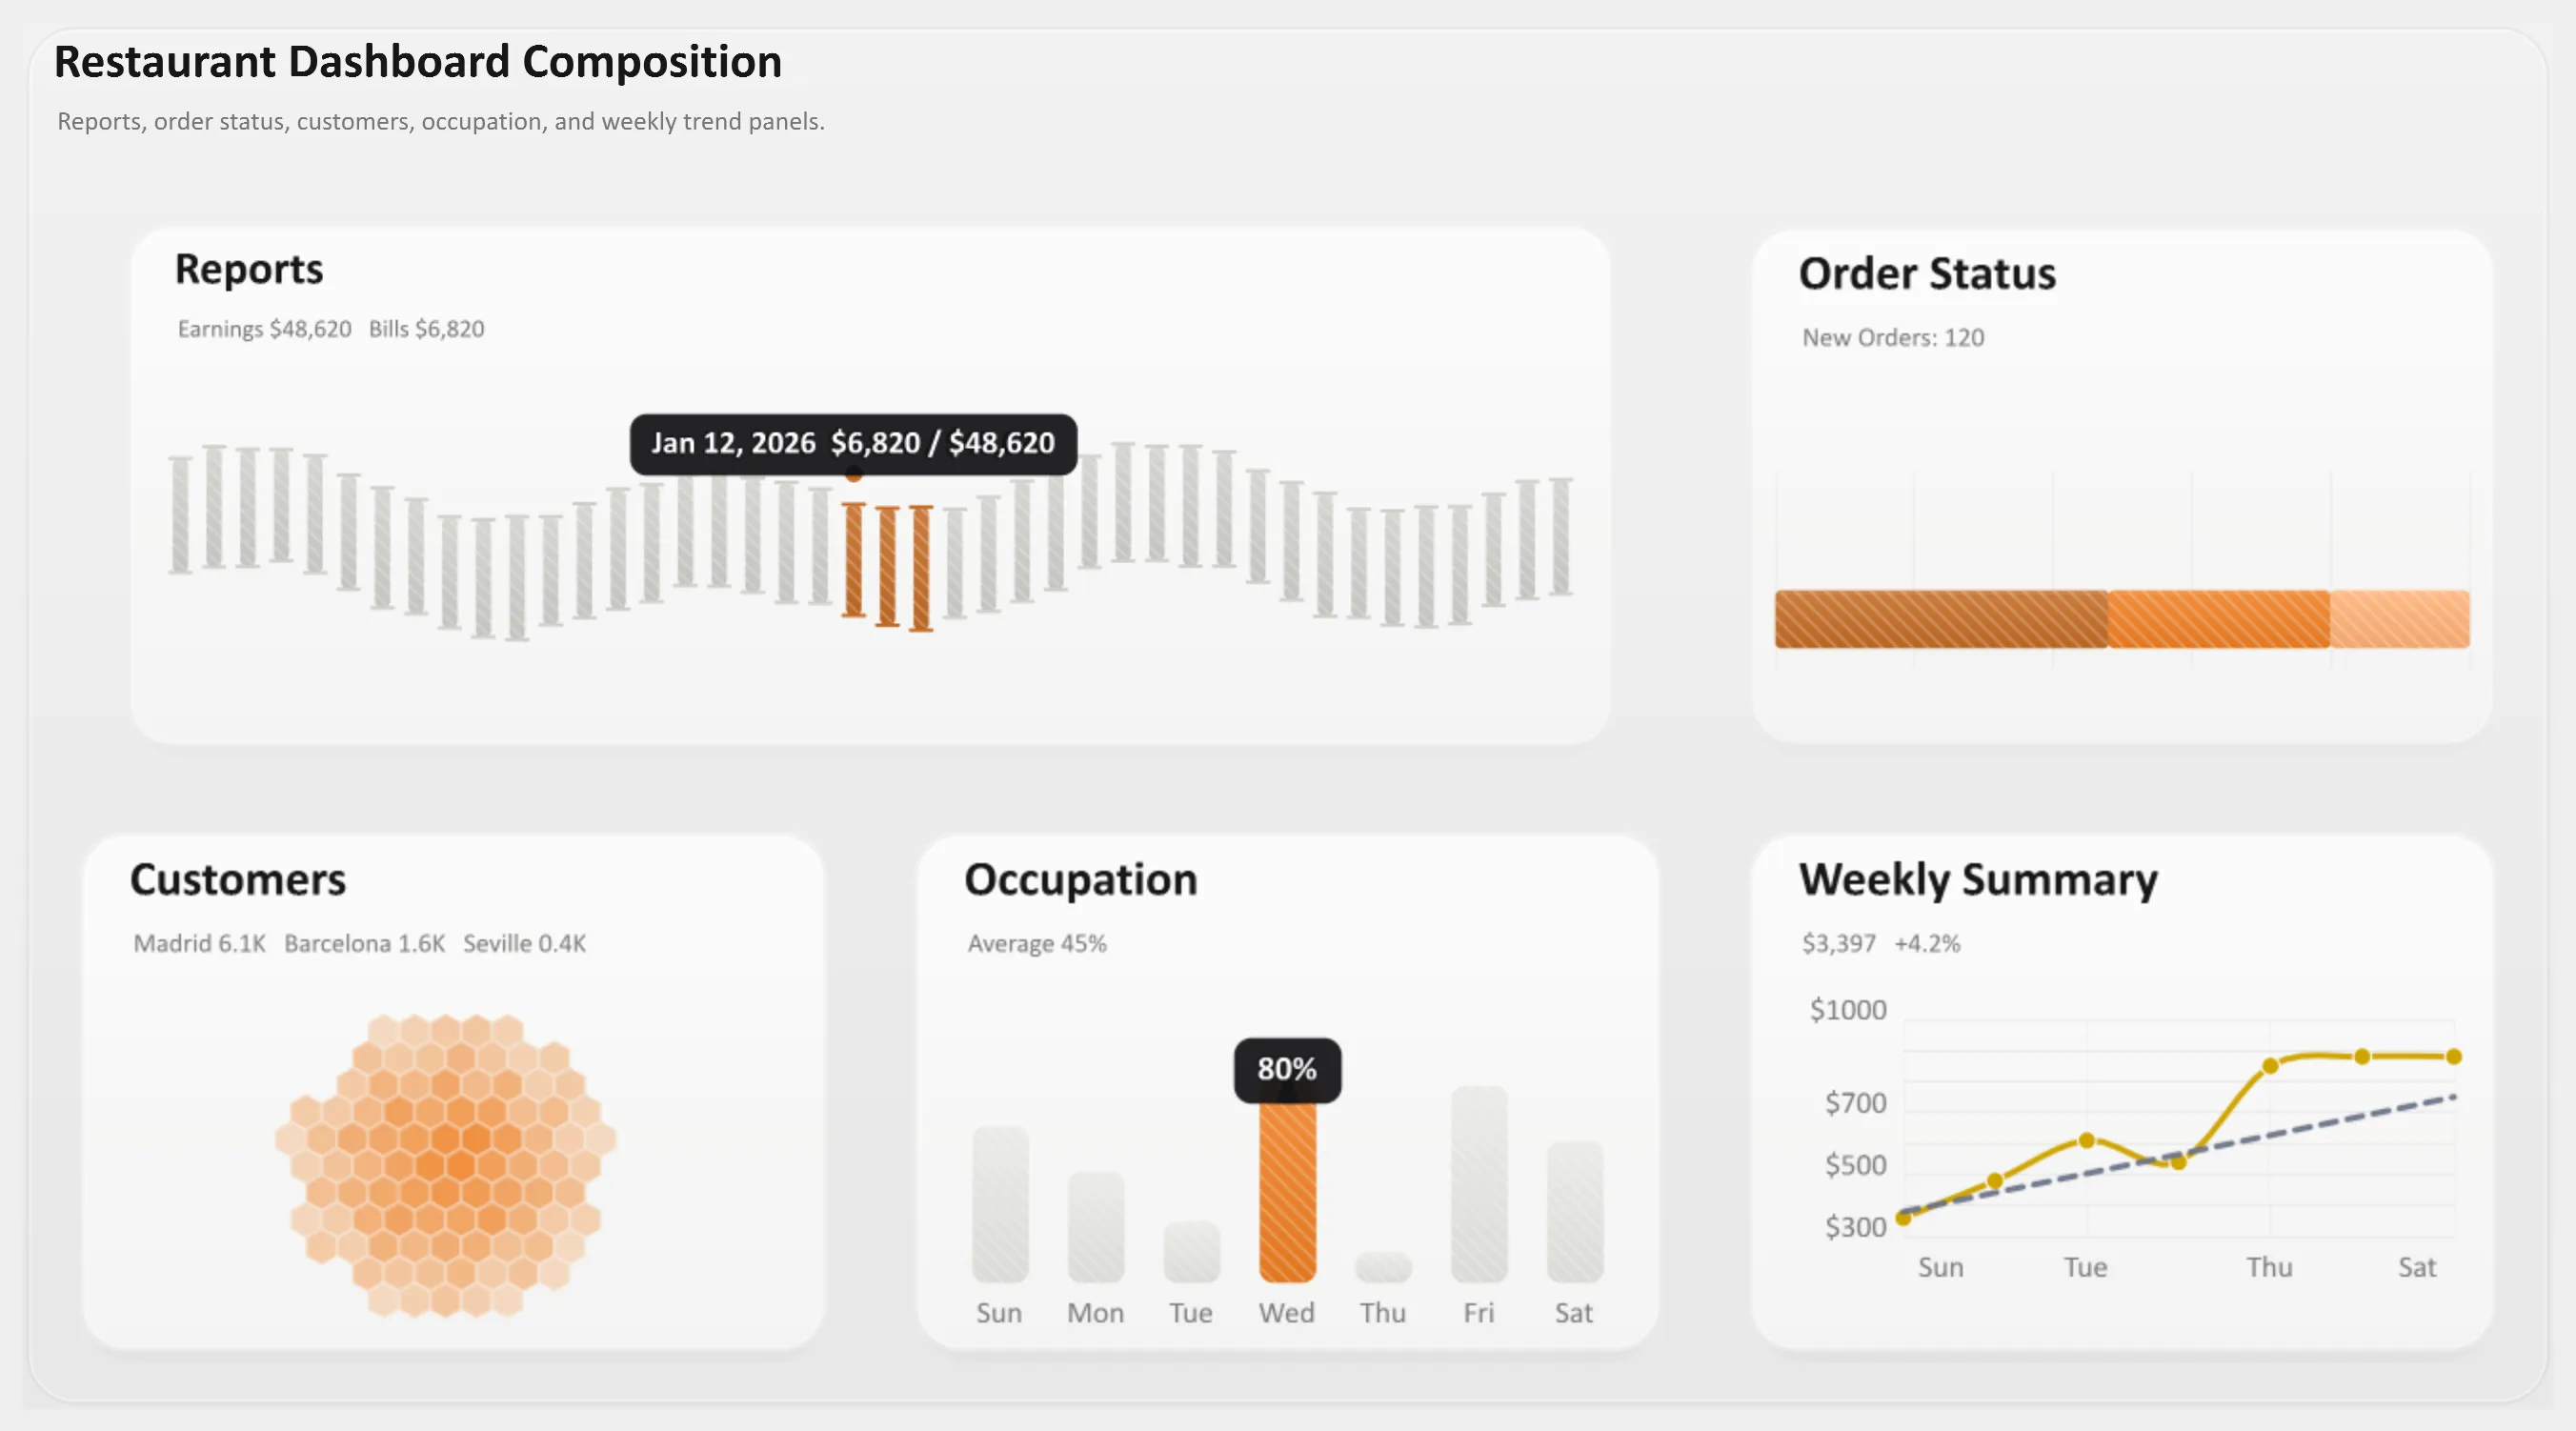
Restaurant operations dashboard
A report-ready operations canvas combining weekly revenue, order status, customer patterns, occupation, and compact KPI summaries.
- VisualGrid
- mixed charts
- KPI composition
- SVG and PNG parity

When to use it and how to rebuild it
Use it when: Combine several visual blocks into a single executive or operational report without relying on a browser charting runtime.
Entry: DashboardPortfolioExamples.Write(output, pngOutputScale)
dotnet run --project .\ChartForgeX.Examples\ChartForgeX.Examples.csproj -c Release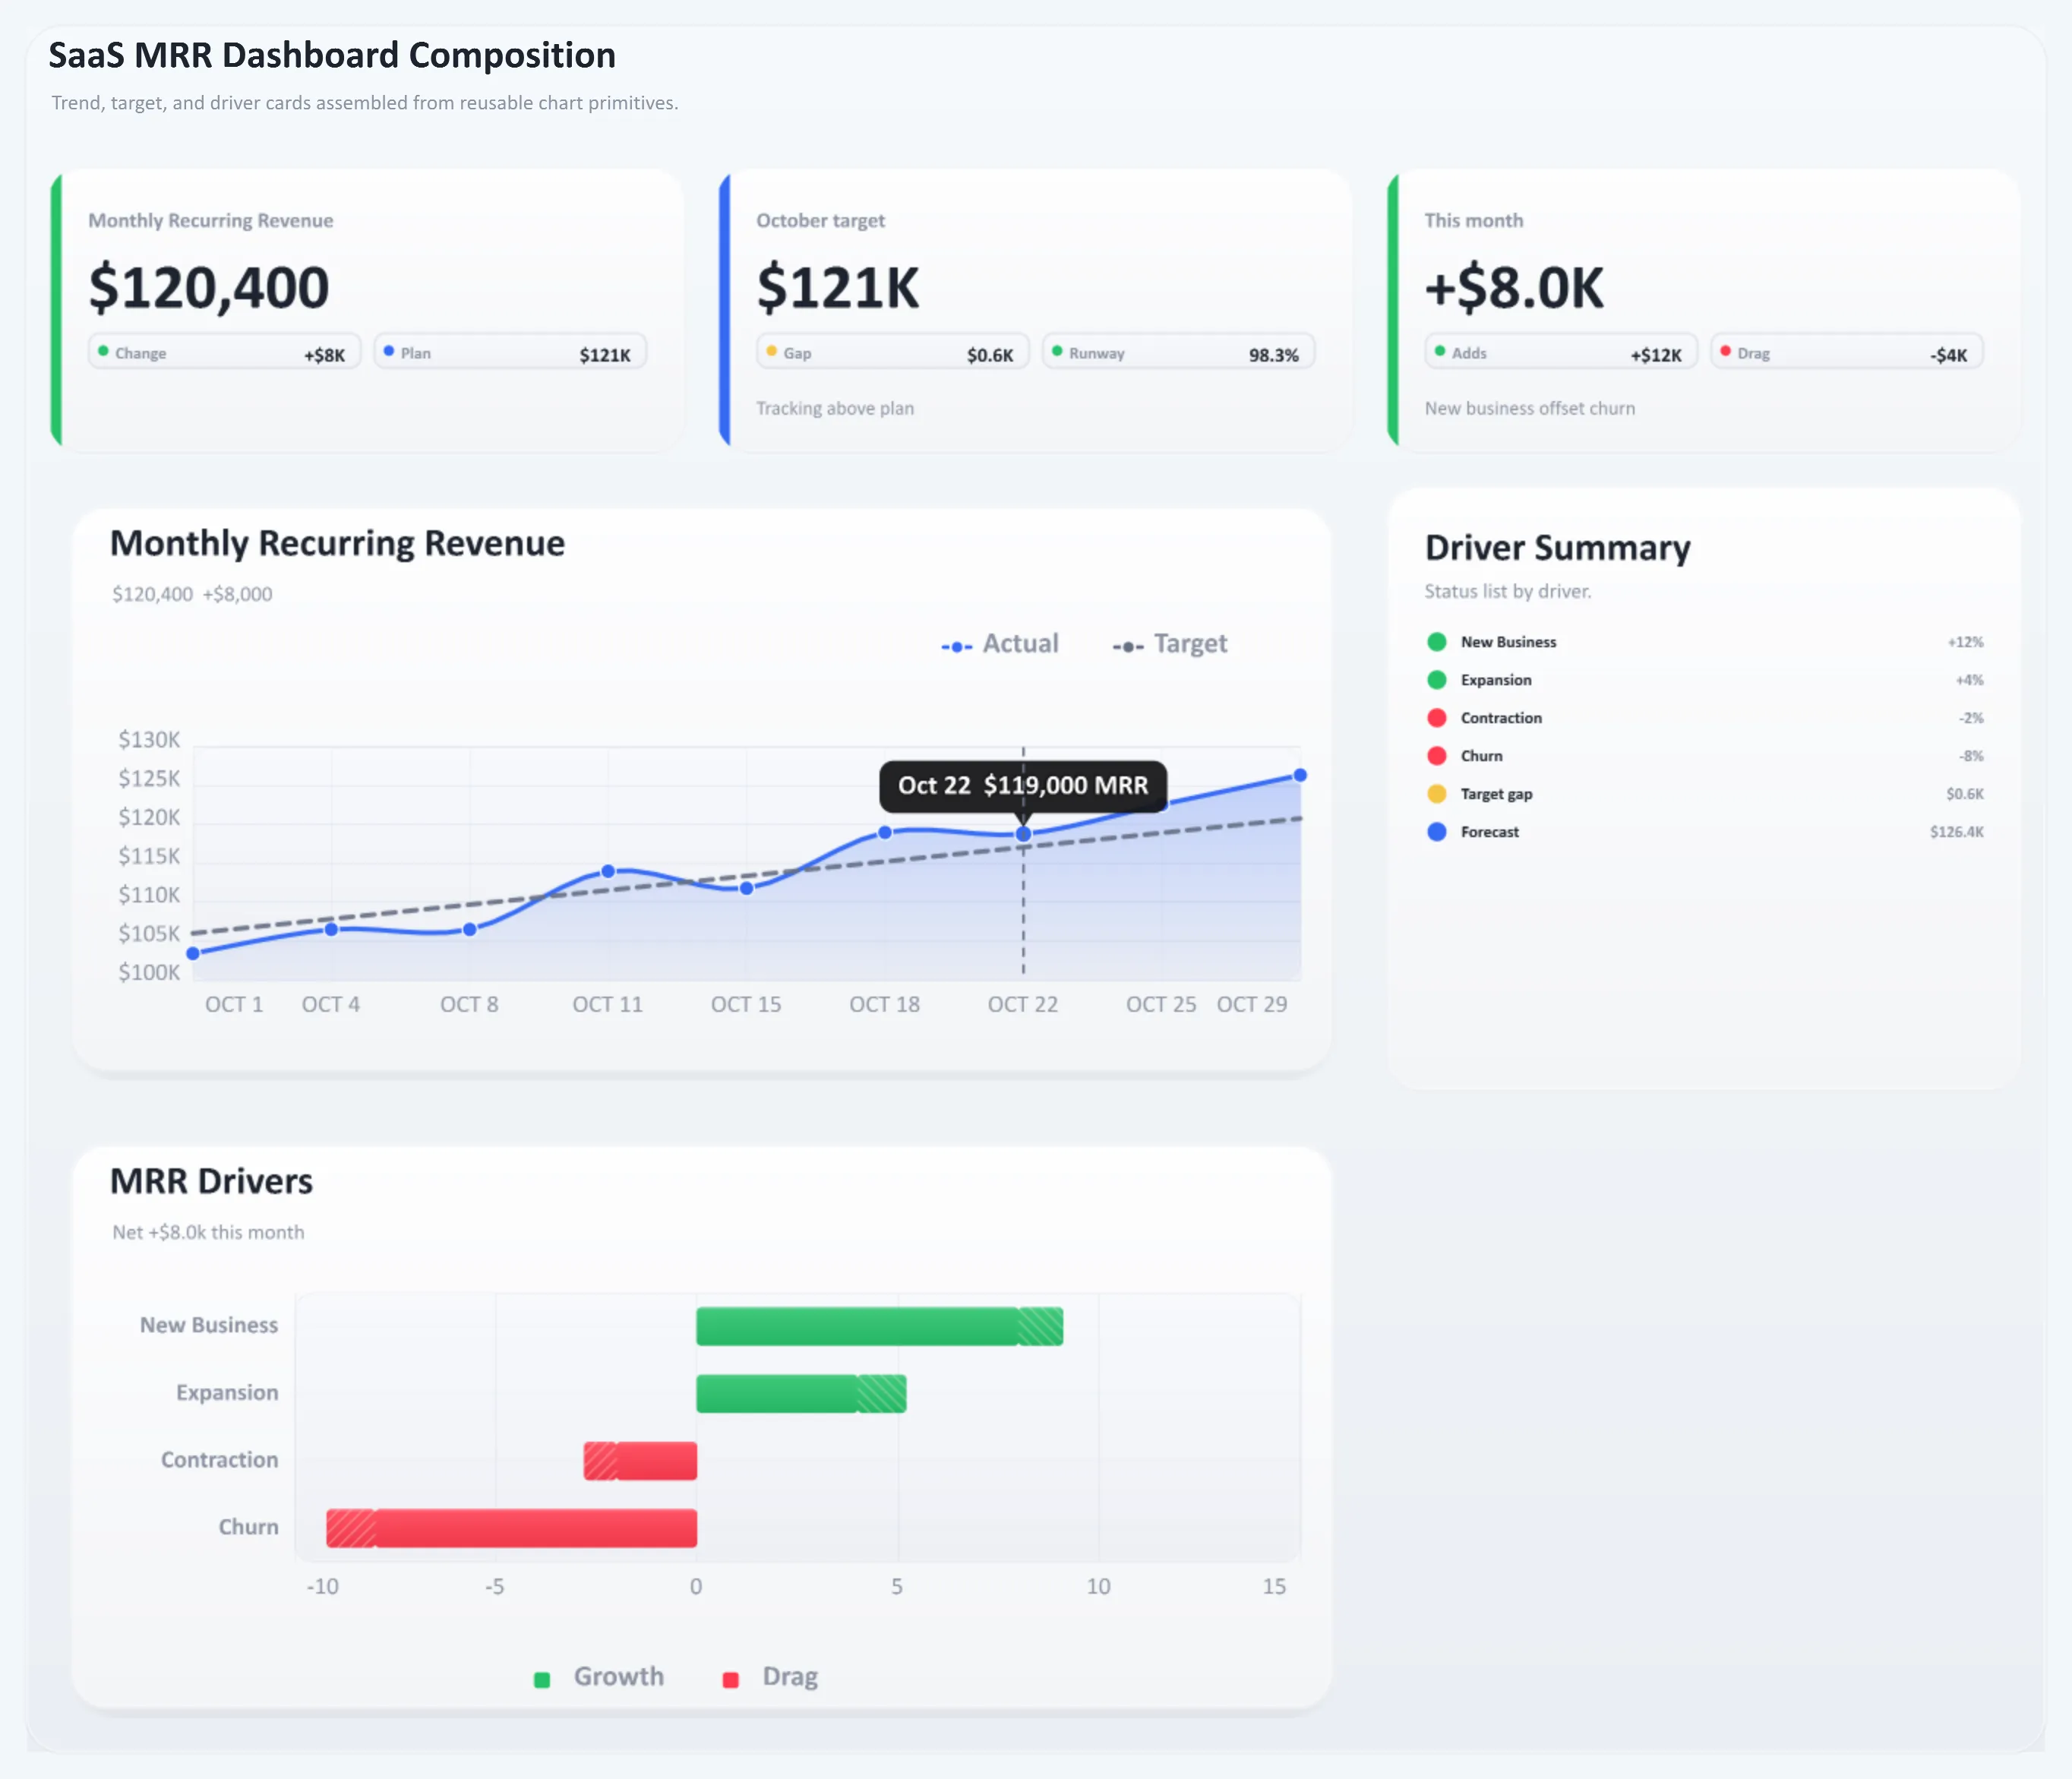 Enlarge image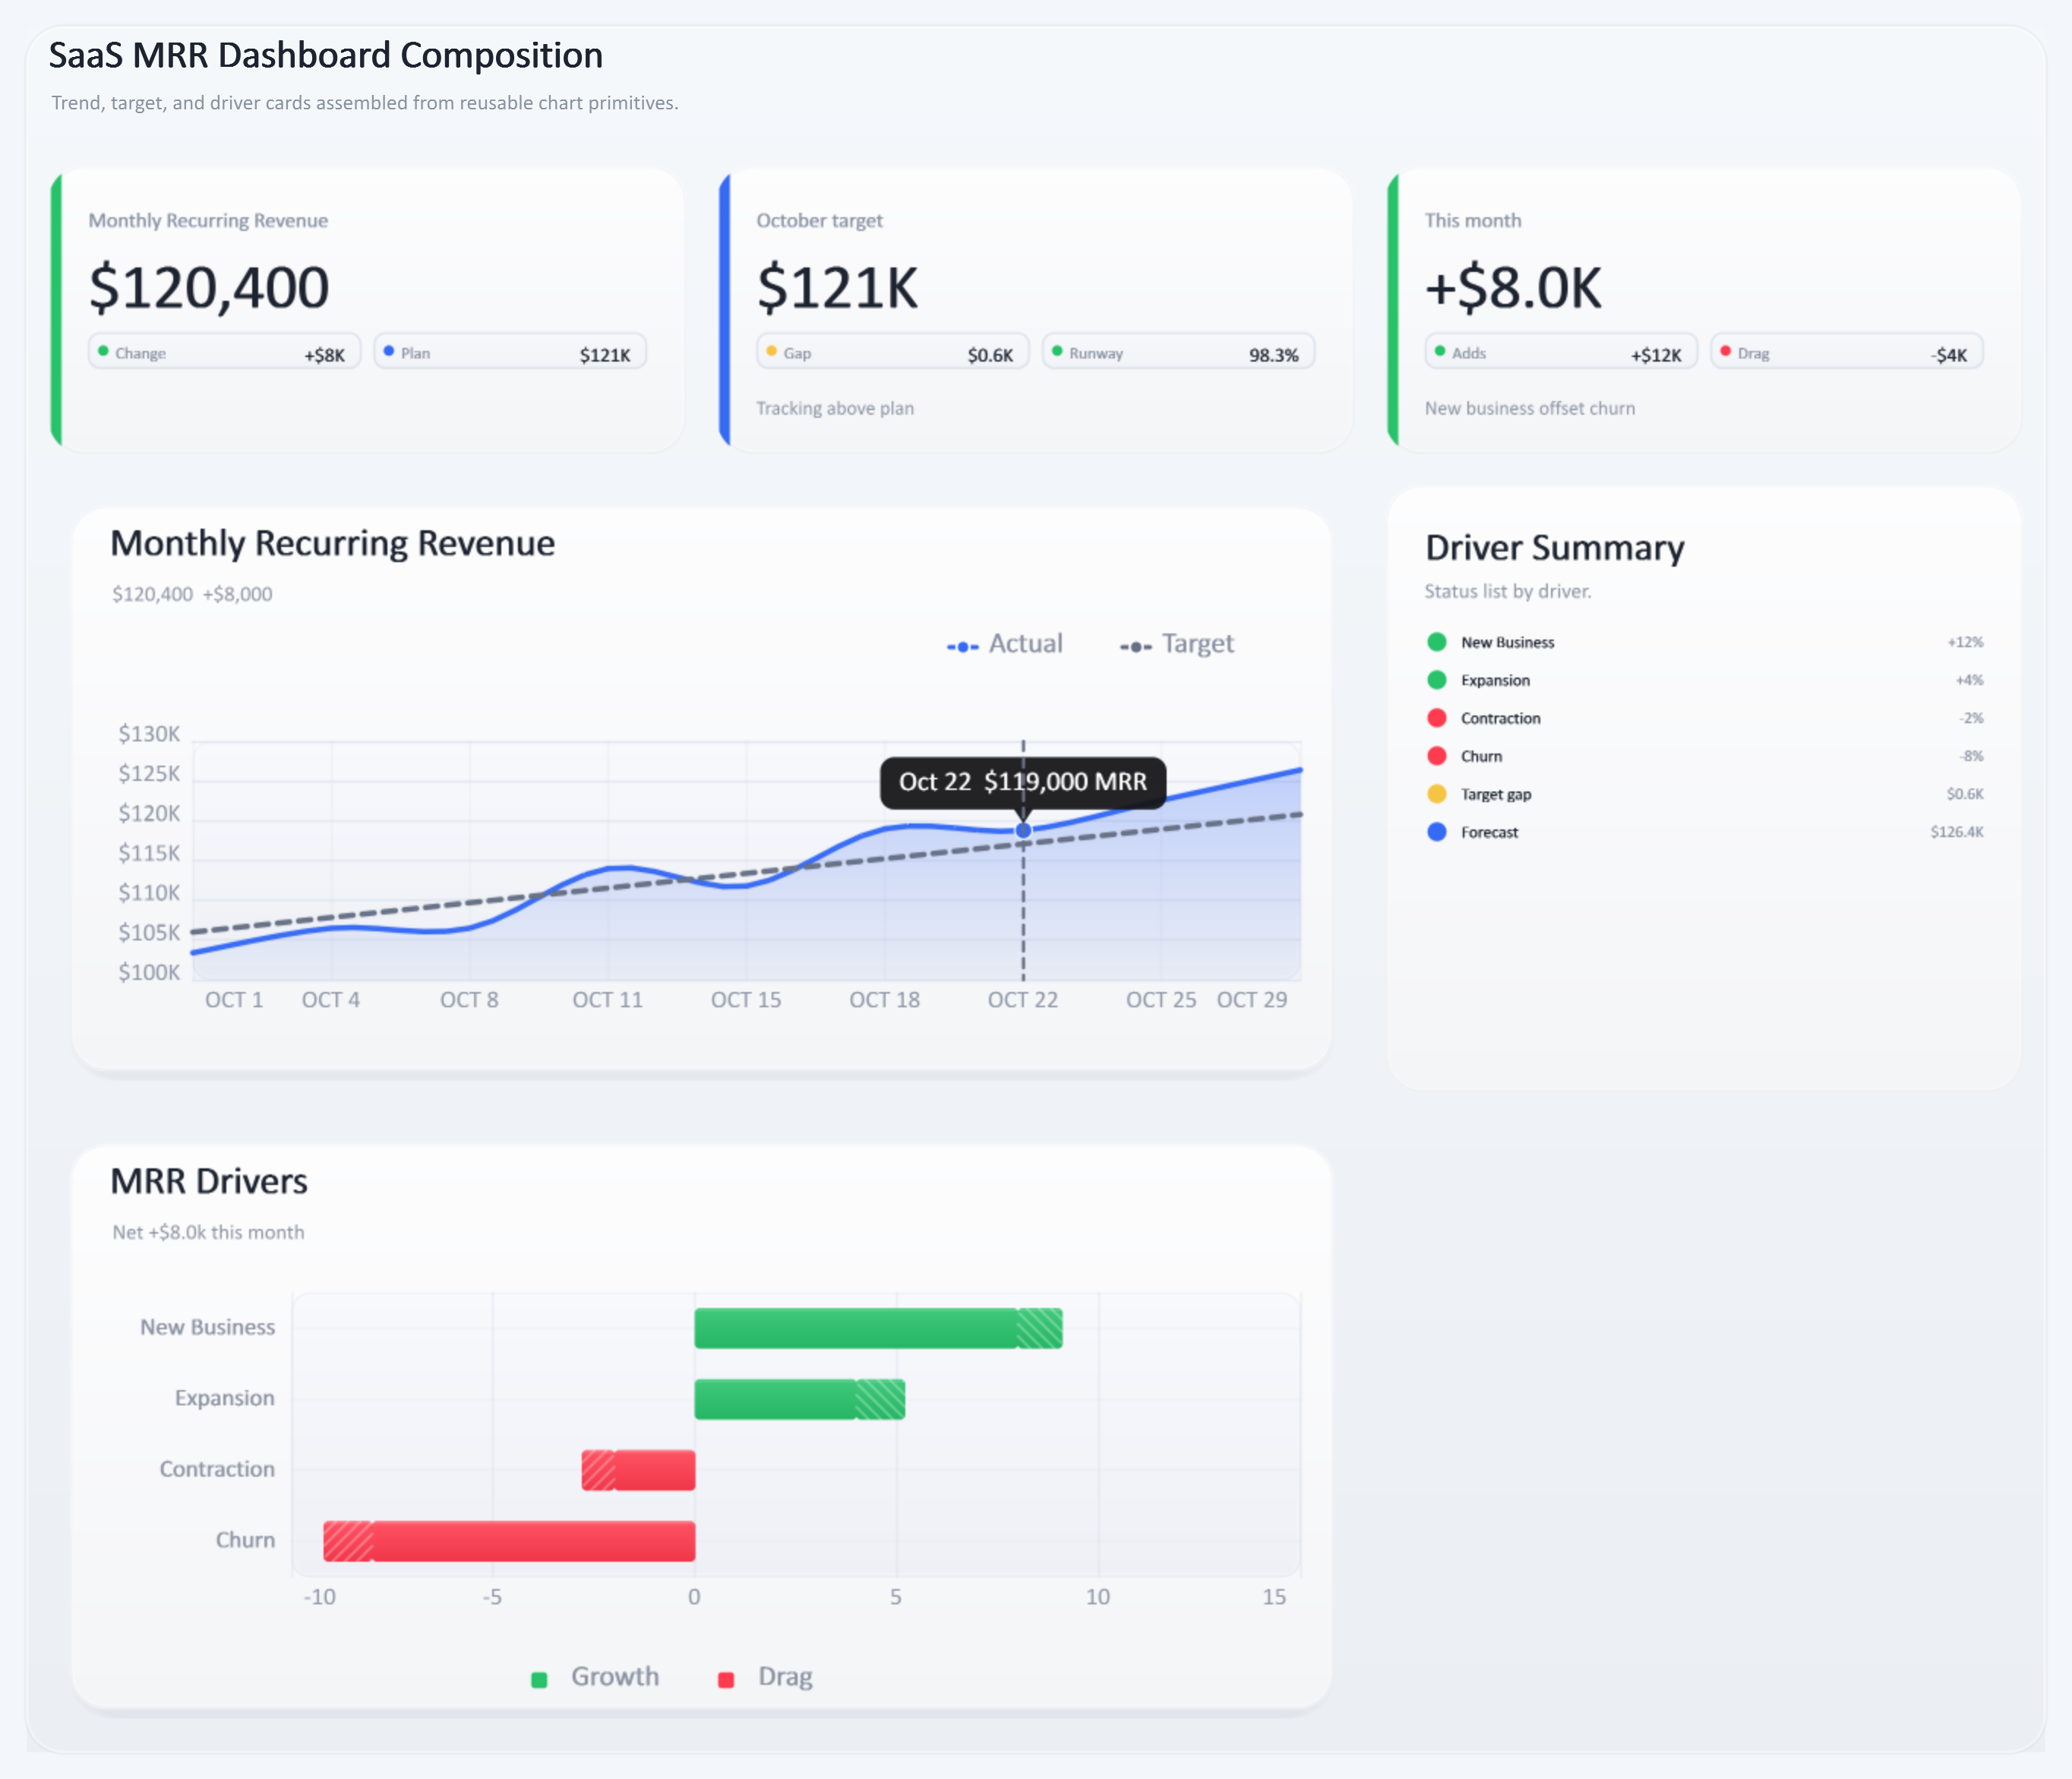
Dashboards
SaaS revenue and retention dashboard
Monthly recurring revenue, movement drivers, churn context, and supporting KPI cards composed into one deterministic dashboard.
- financial reporting
- small multiples
- sparklines
- static export

When to use it and how to rebuild it
Use it when: Produce repeatable finance and product reporting for email, documentation, dashboards, and generated reports from the same model.
Entry: DashboardPortfolioExamples.Write(output, pngOutputScale)
dotnet run --project .\ChartForgeX.Examples\ChartForgeX.Examples.csproj -c Release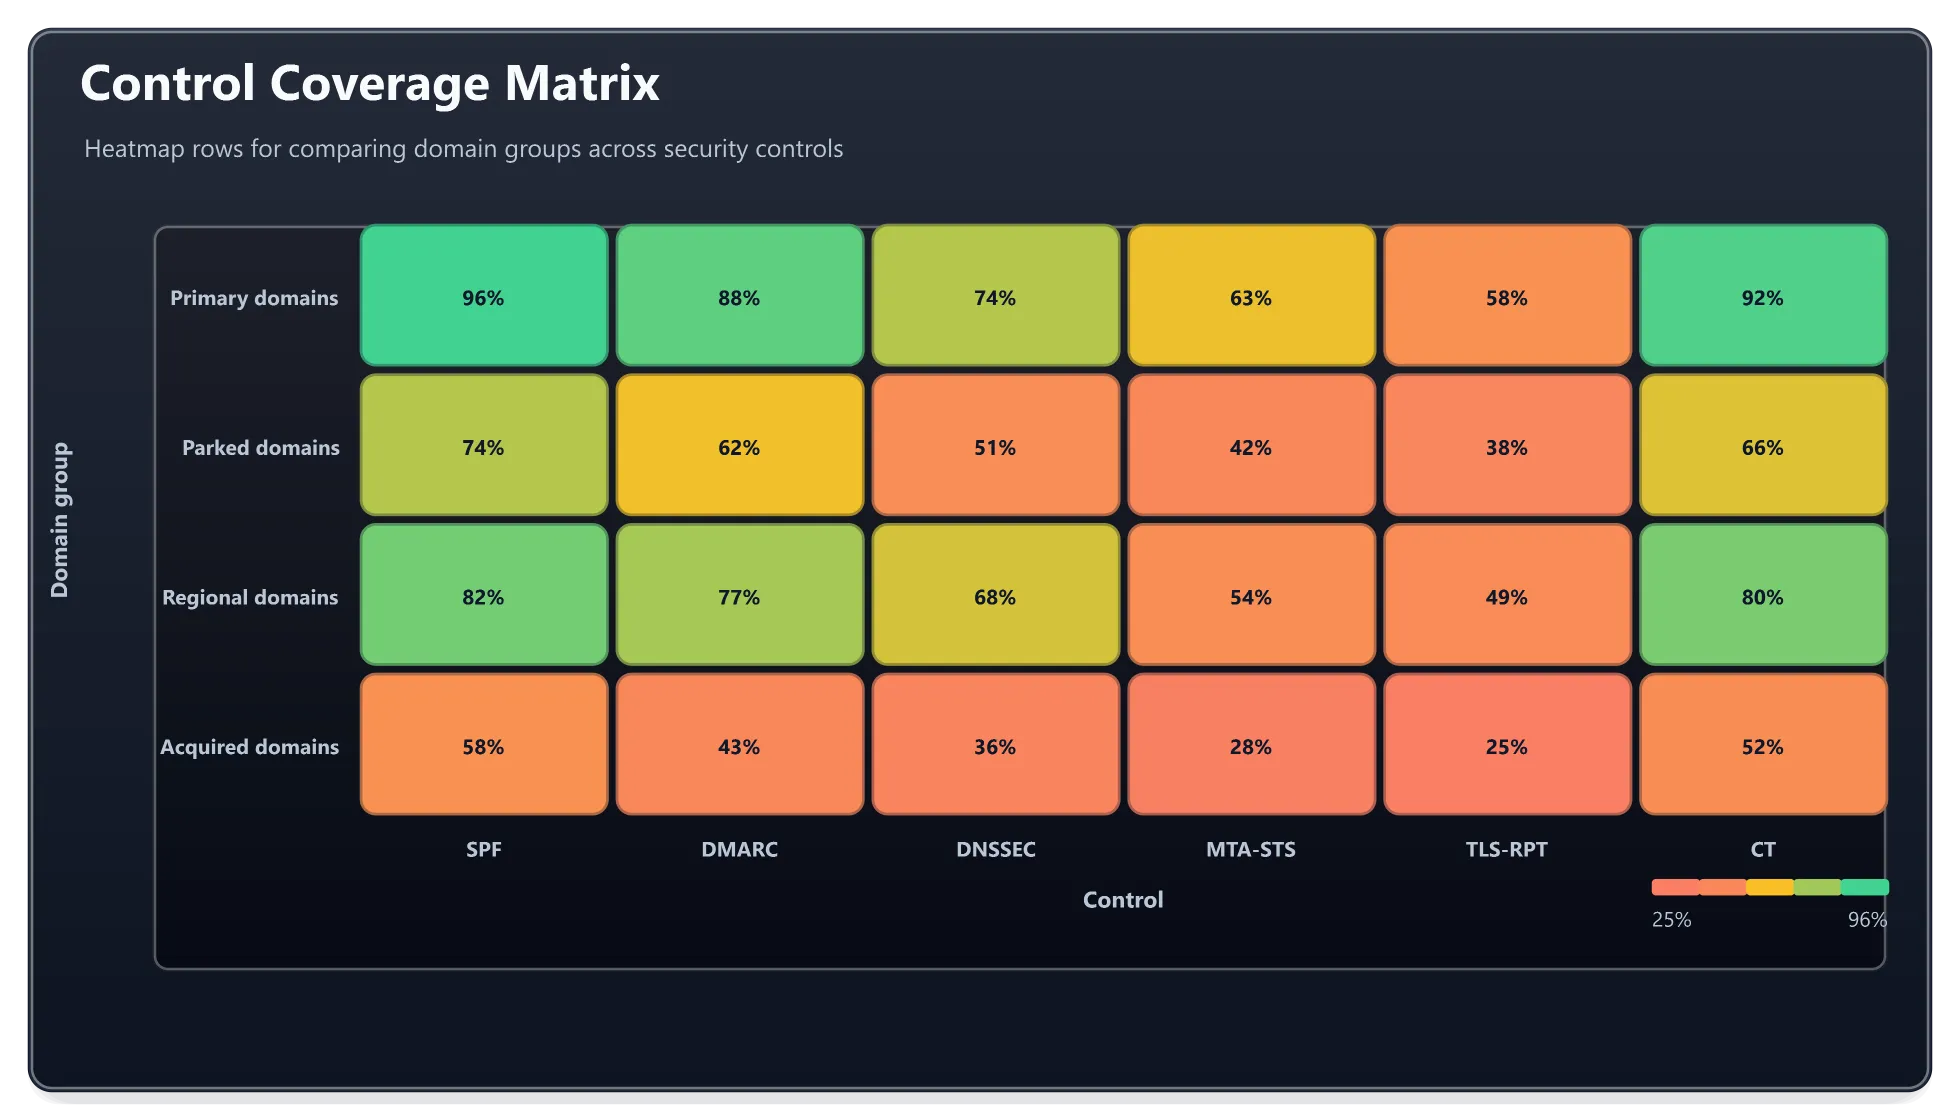 Enlarge image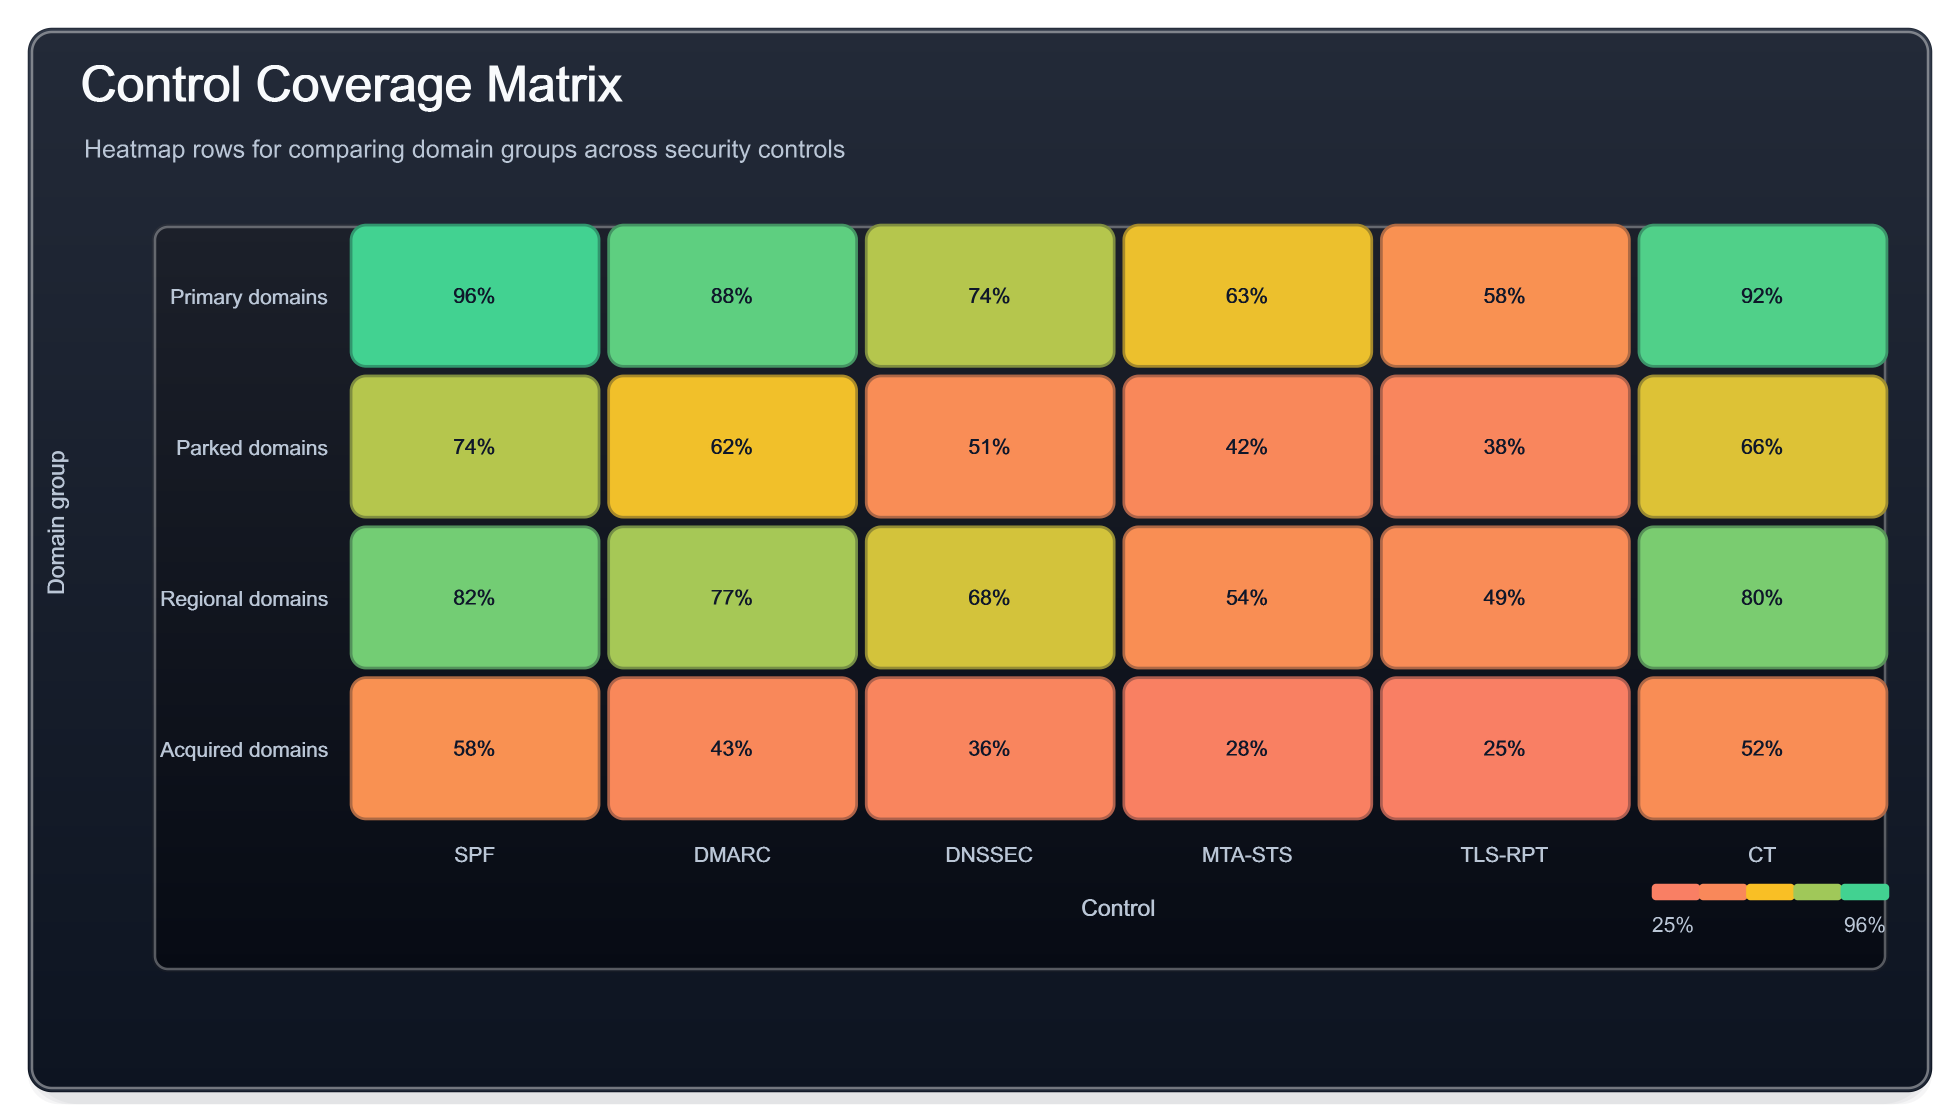
Charts
Control coverage matrix
A heatmap that compares security domains across controls with semantic colors, readable labels, and an explicit value scale.
- heatmap
- semantic scale
- data labels
- C# sample

When to use it and how to rebuild it
Use it when: Turn a dense assessment matrix into a compact visual that remains readable in a report or exported image.
Entry: SaveChart(heatmap, "control-coverage-heatmap-dark")
dotnet run --project .\ChartForgeX.Examples\ChartForgeX.Examples.csproj -c Release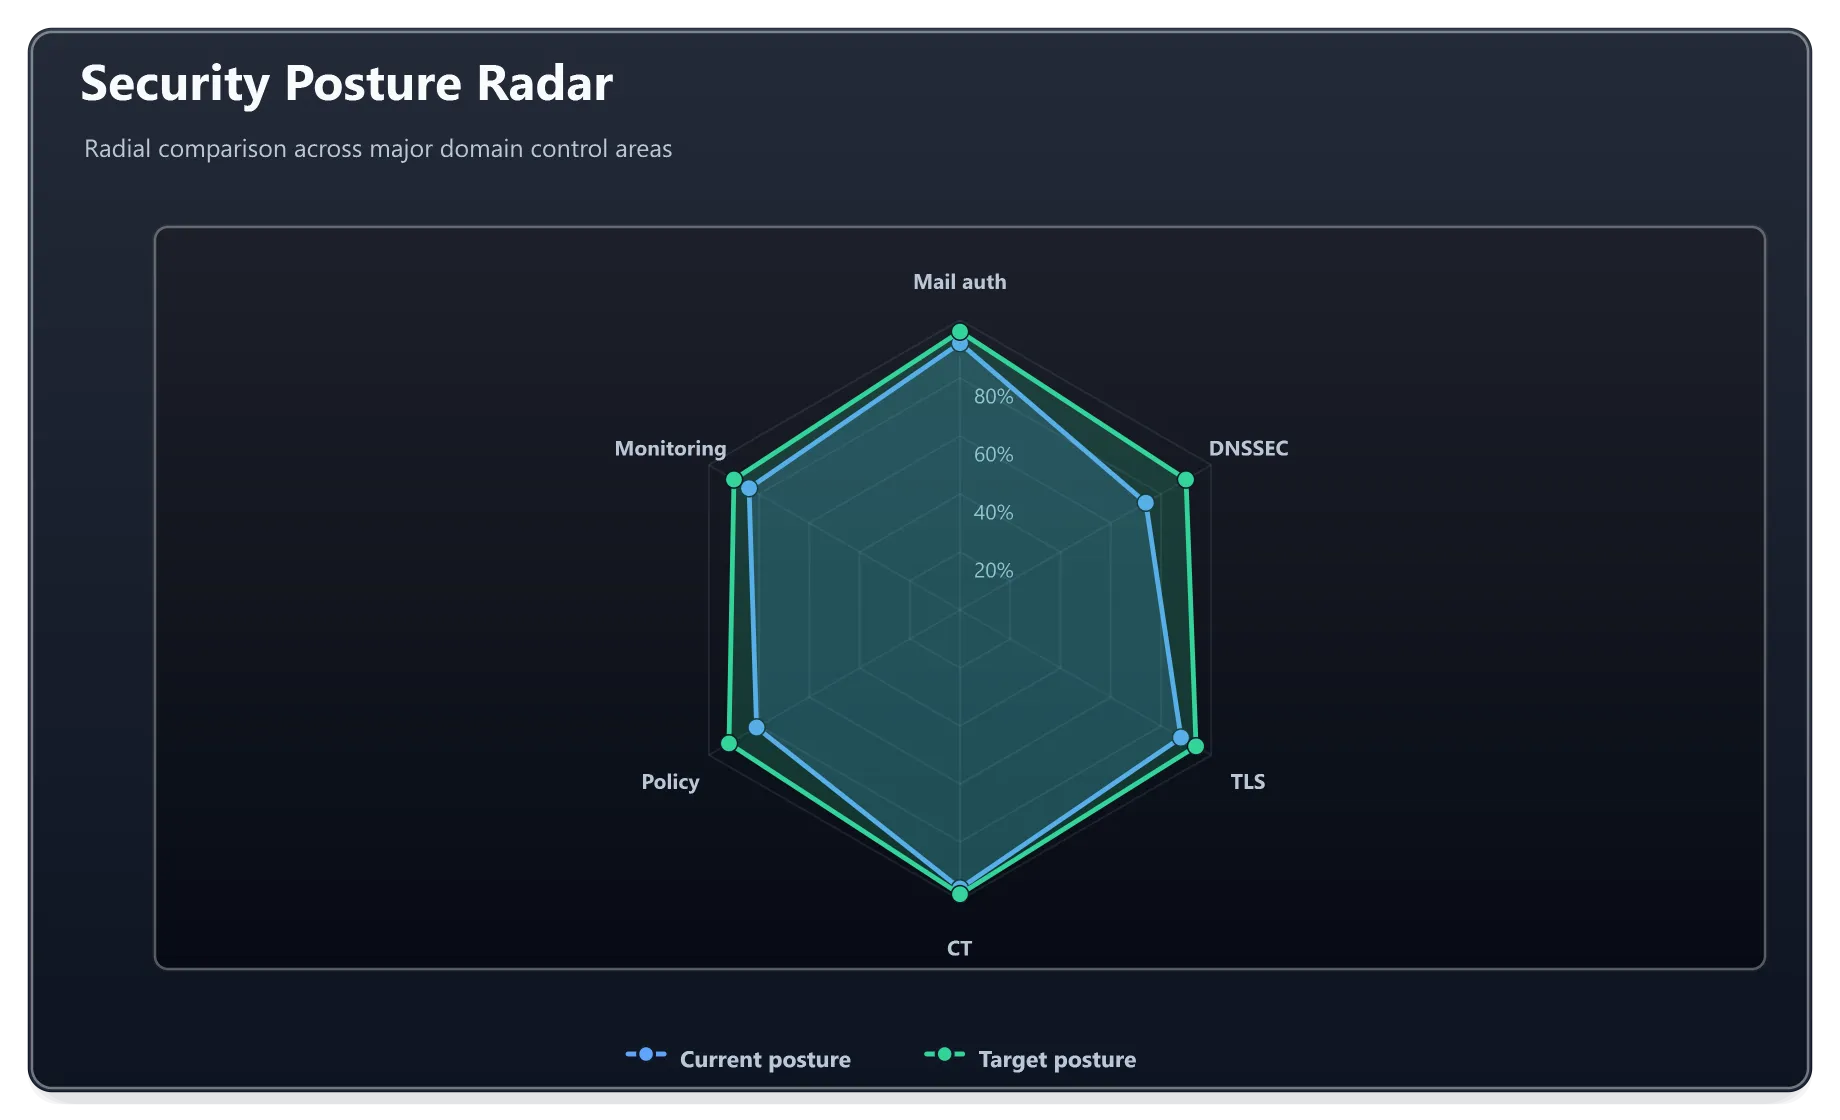 Enlarge image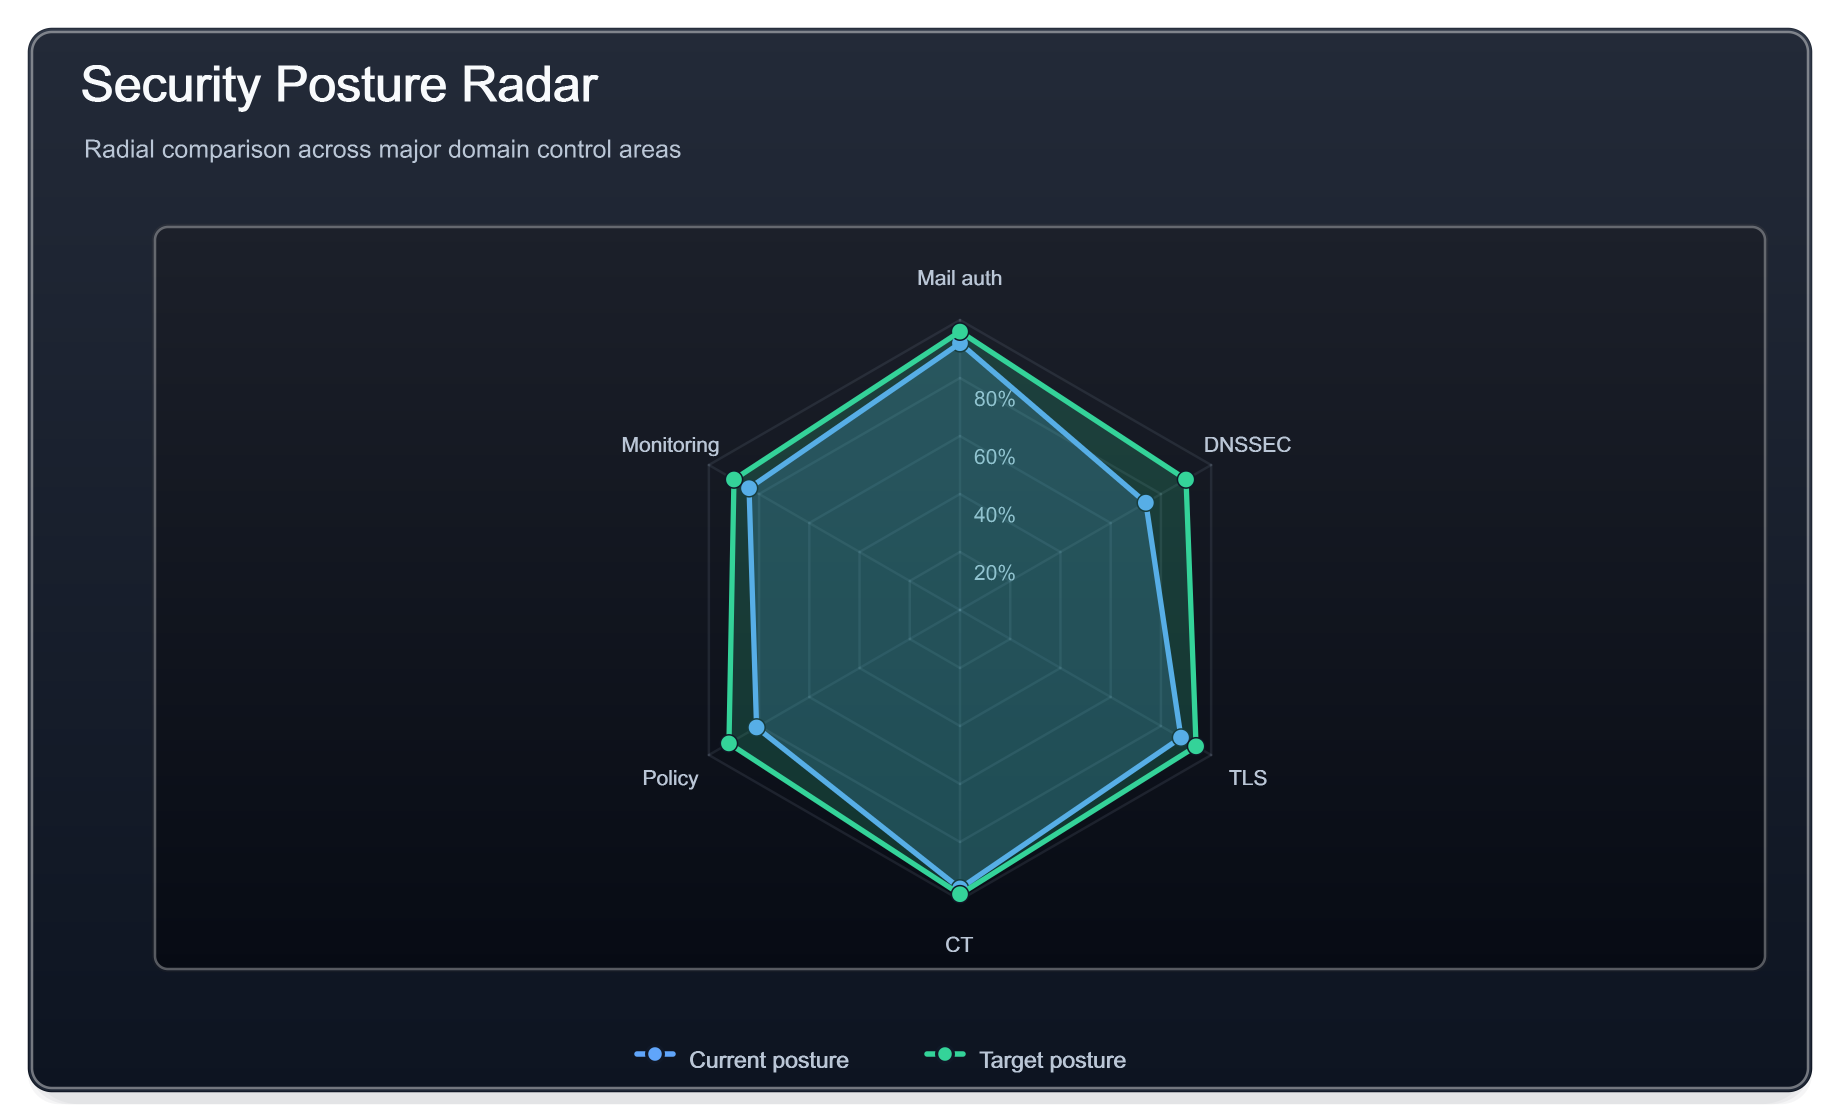
Charts
Security posture radar
A dark-theme radar chart for comparing posture across identity, endpoint, data, network, application, and operational dimensions.
- radar
- dark theme
- semantic labels
- report export

When to use it and how to rebuild it
Use it when: Show a multidimensional posture summary when the relationships between dimensions matter more than a ranked table.
Entry: SaveChart(radar, "security-posture-radar-dark")
dotnet run --project .\ChartForgeX.Examples\ChartForgeX.Examples.csproj -c Release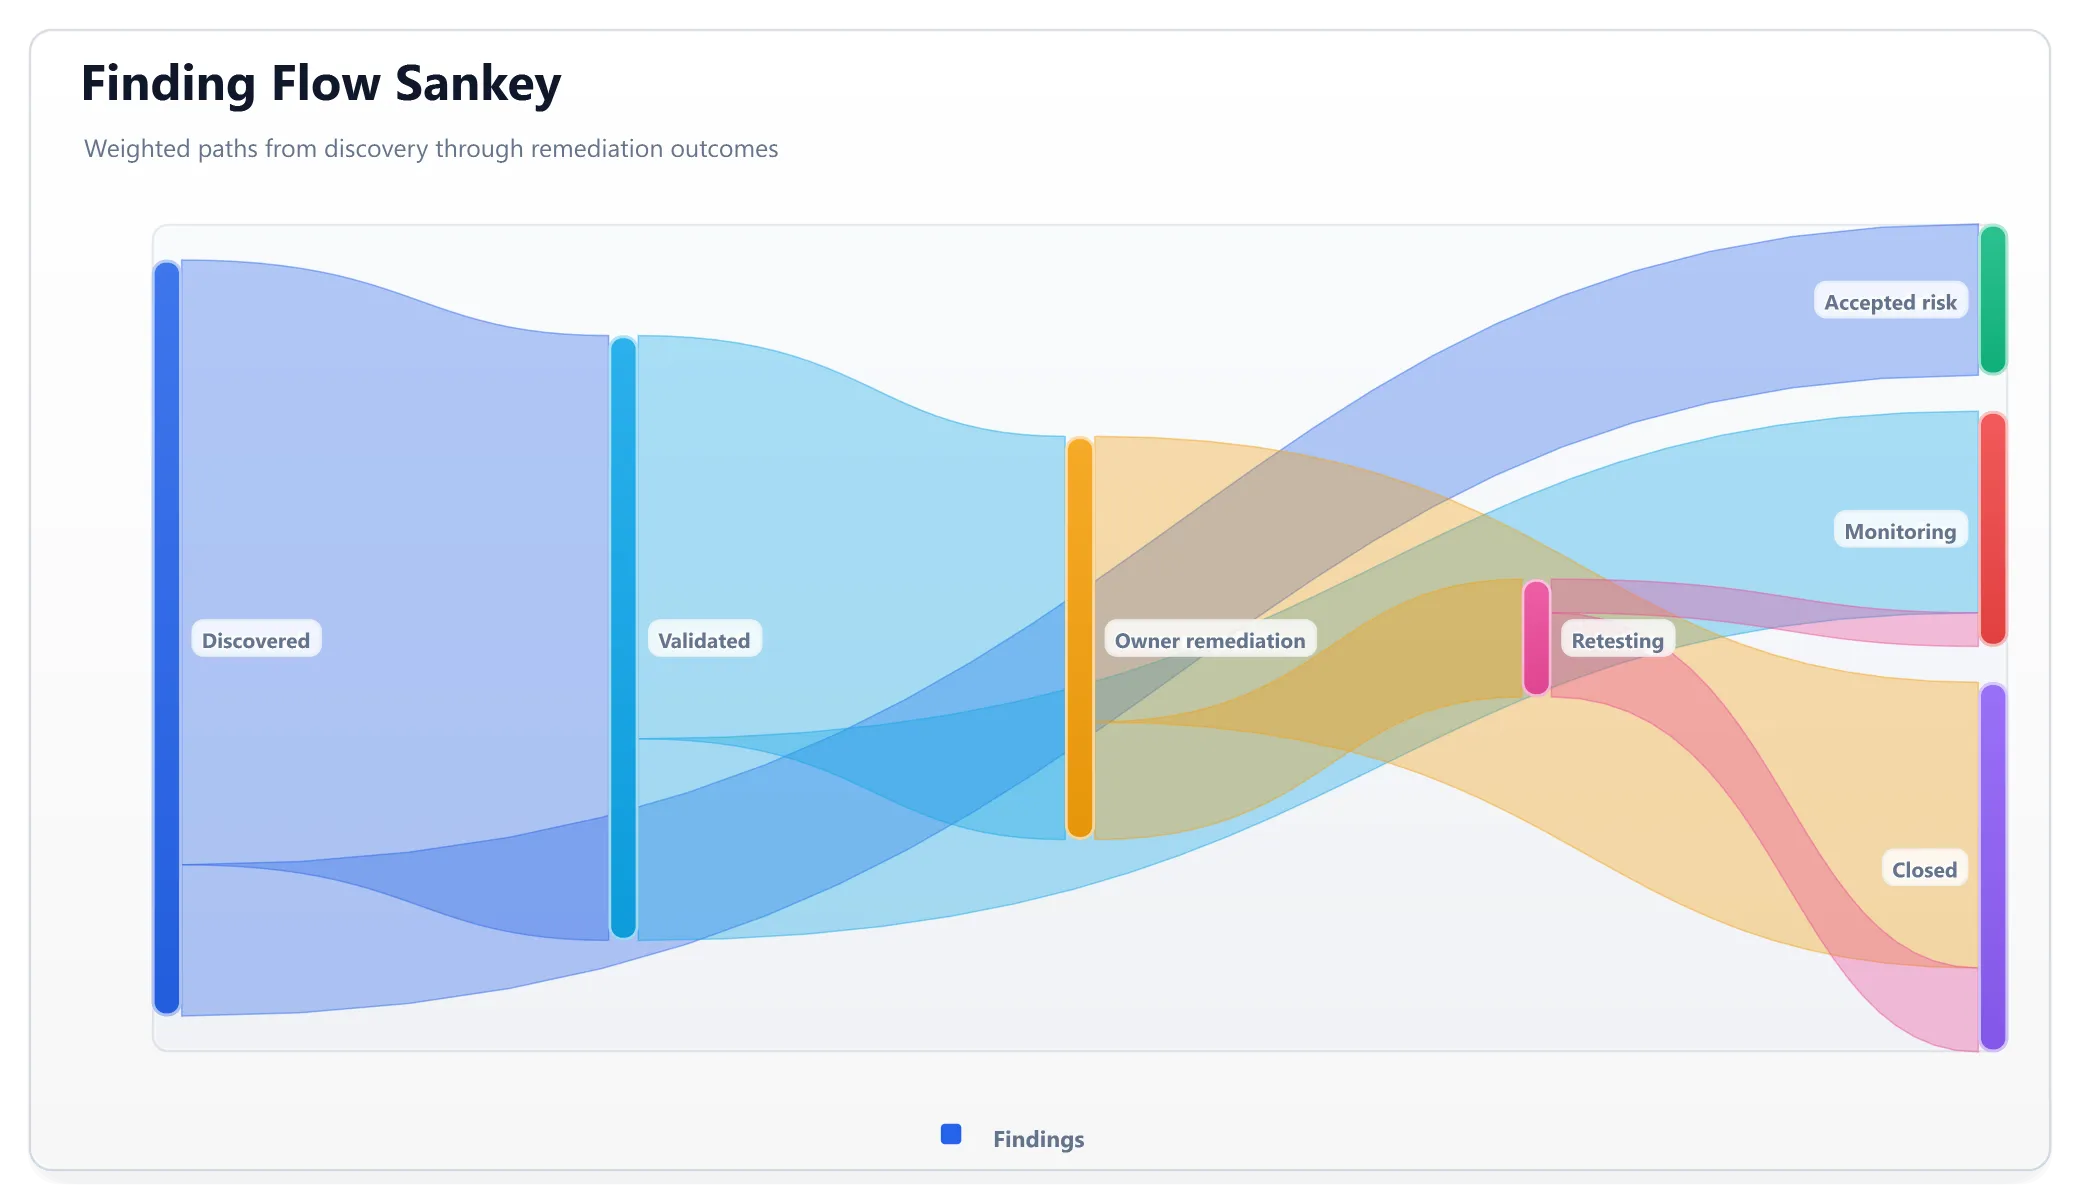 Enlarge image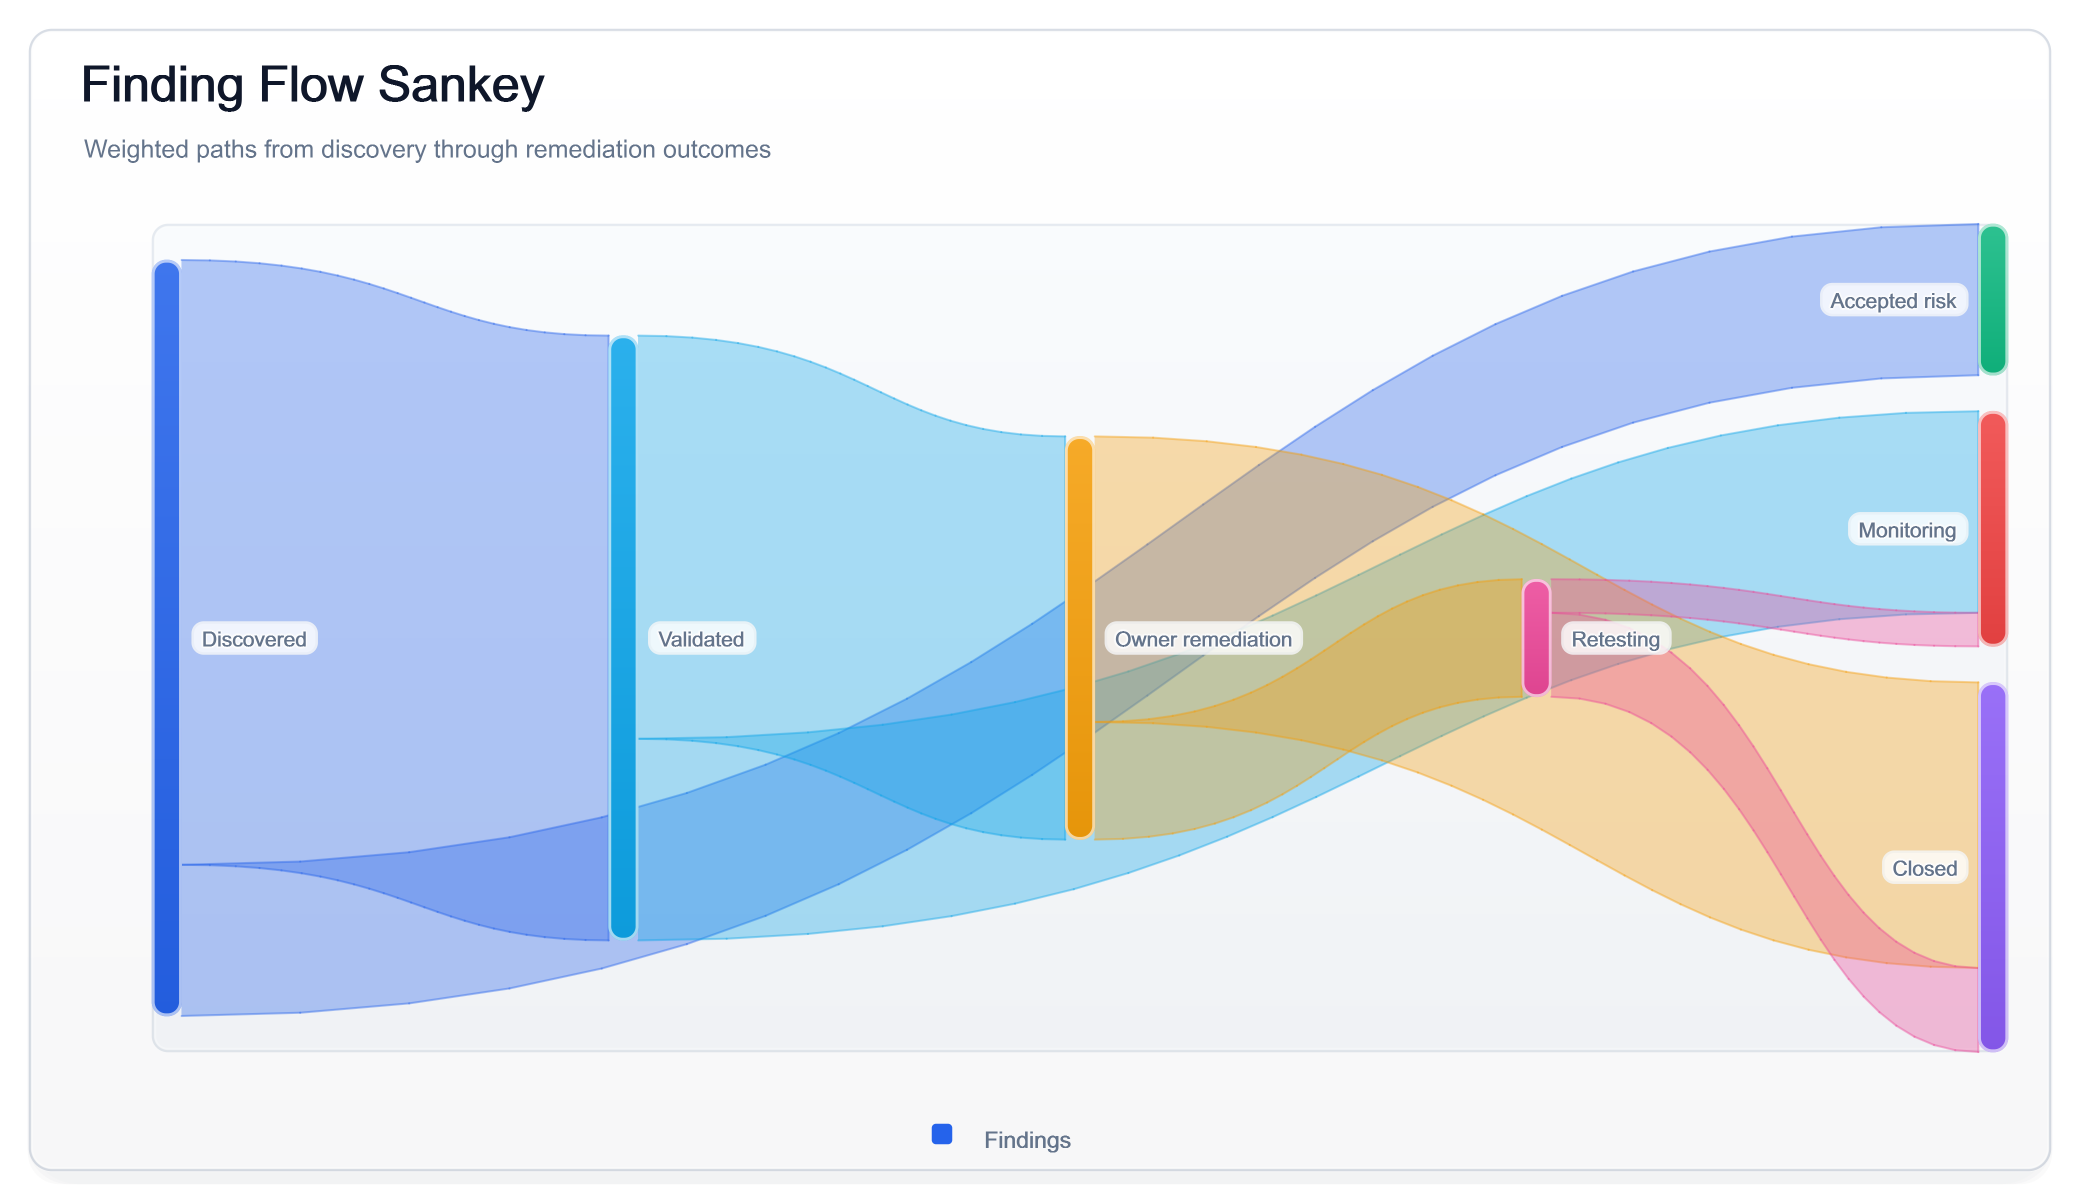
Charts
Finding remediation flow
A Sankey view tracing weighted findings from discovery through triage, ownership, remediation, and monitoring.
- Sankey
- weighted flow
- stage labels
- static export

When to use it and how to rebuild it
Use it when: Explain where work accumulates or drops out across a multi-stage operational process.
Entry: SaveChart(findingFlow, "finding-flow-sankey-light")
dotnet run --project .\ChartForgeX.Examples\ChartForgeX.Examples.csproj -c Release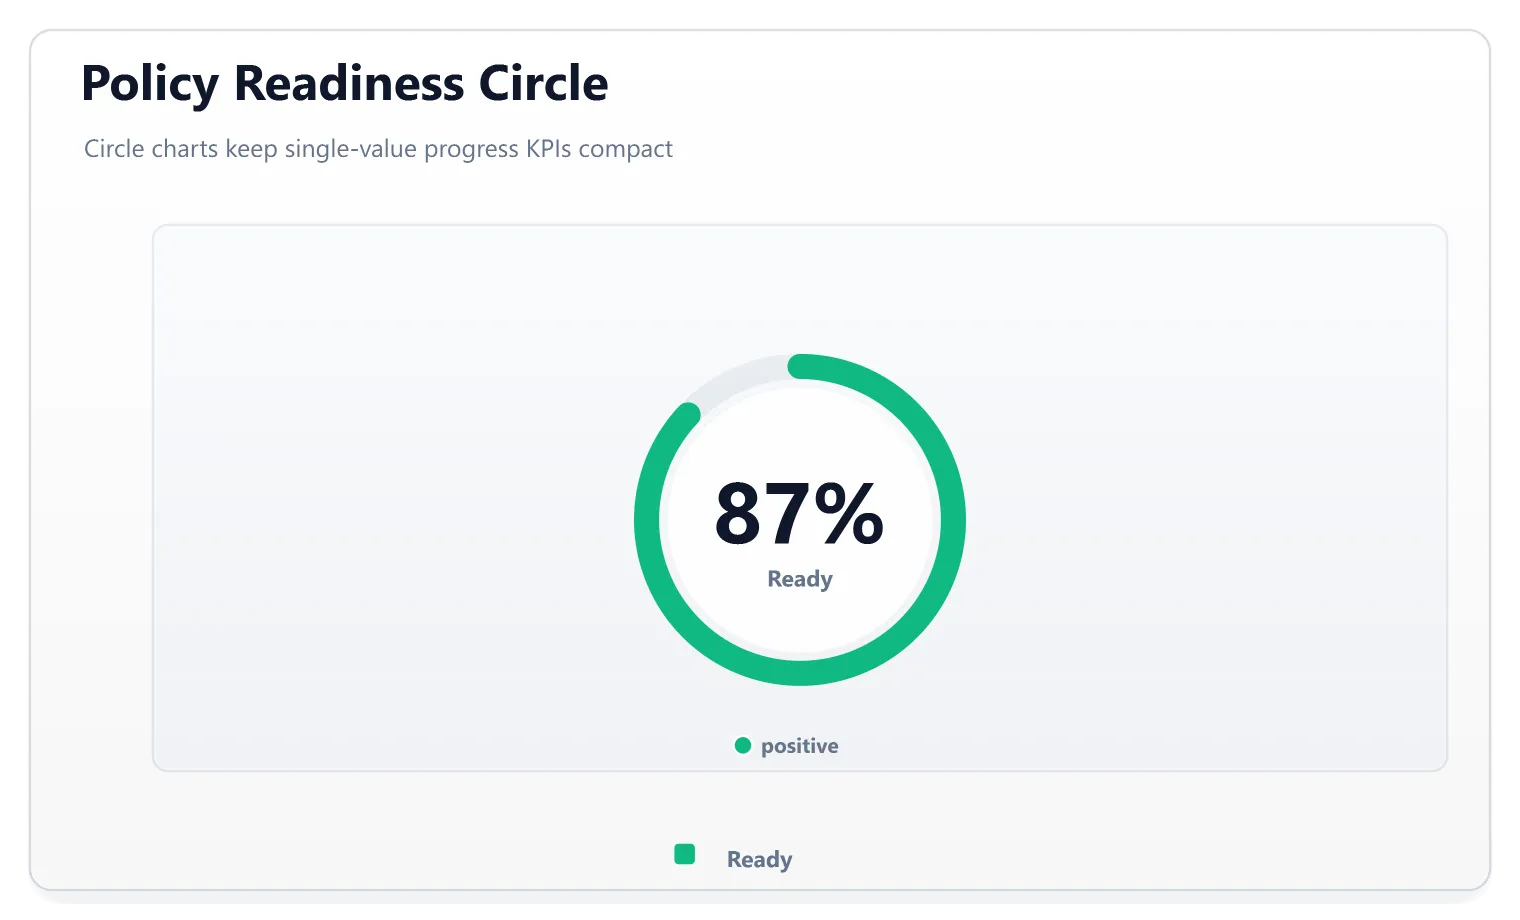 Enlarge image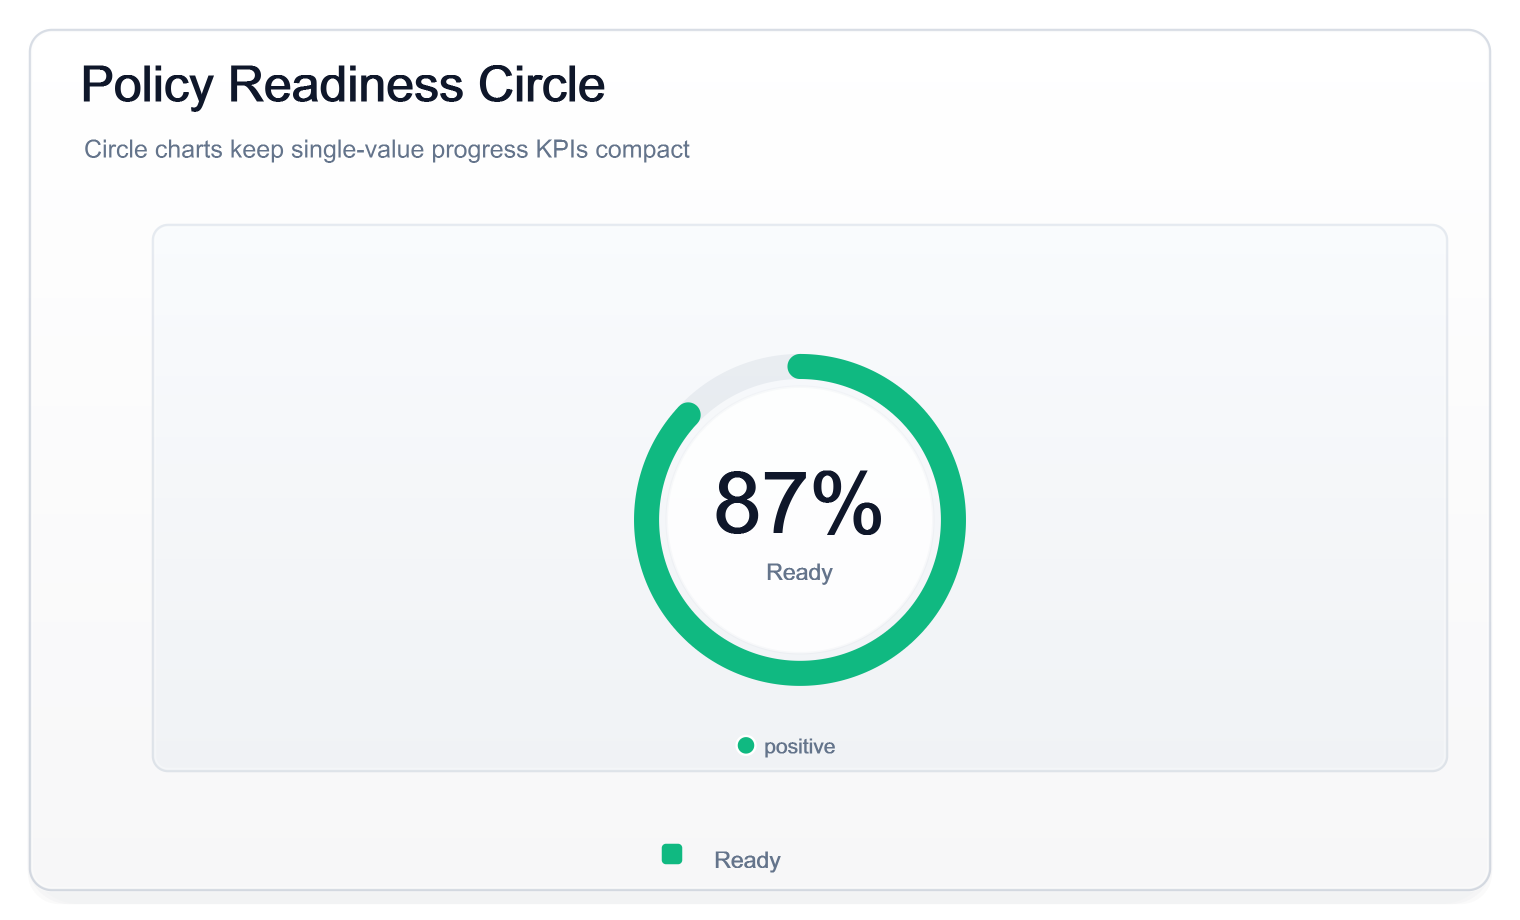
Charts
Policy readiness progress
A compact circular progress visual with an explicit percentage, supporting label, and report-friendly light presentation.
- circle progress
- compact card
- data label
- light theme

When to use it and how to rebuild it
Use it when: Place a clear readiness or completion indicator inside a dashboard card, report strip, or status summary.
Entry: SaveChart(policyReadinessCircle, "policy-readiness-circle-light")
dotnet run --project .\ChartForgeX.Examples\ChartForgeX.Examples.csproj -c Release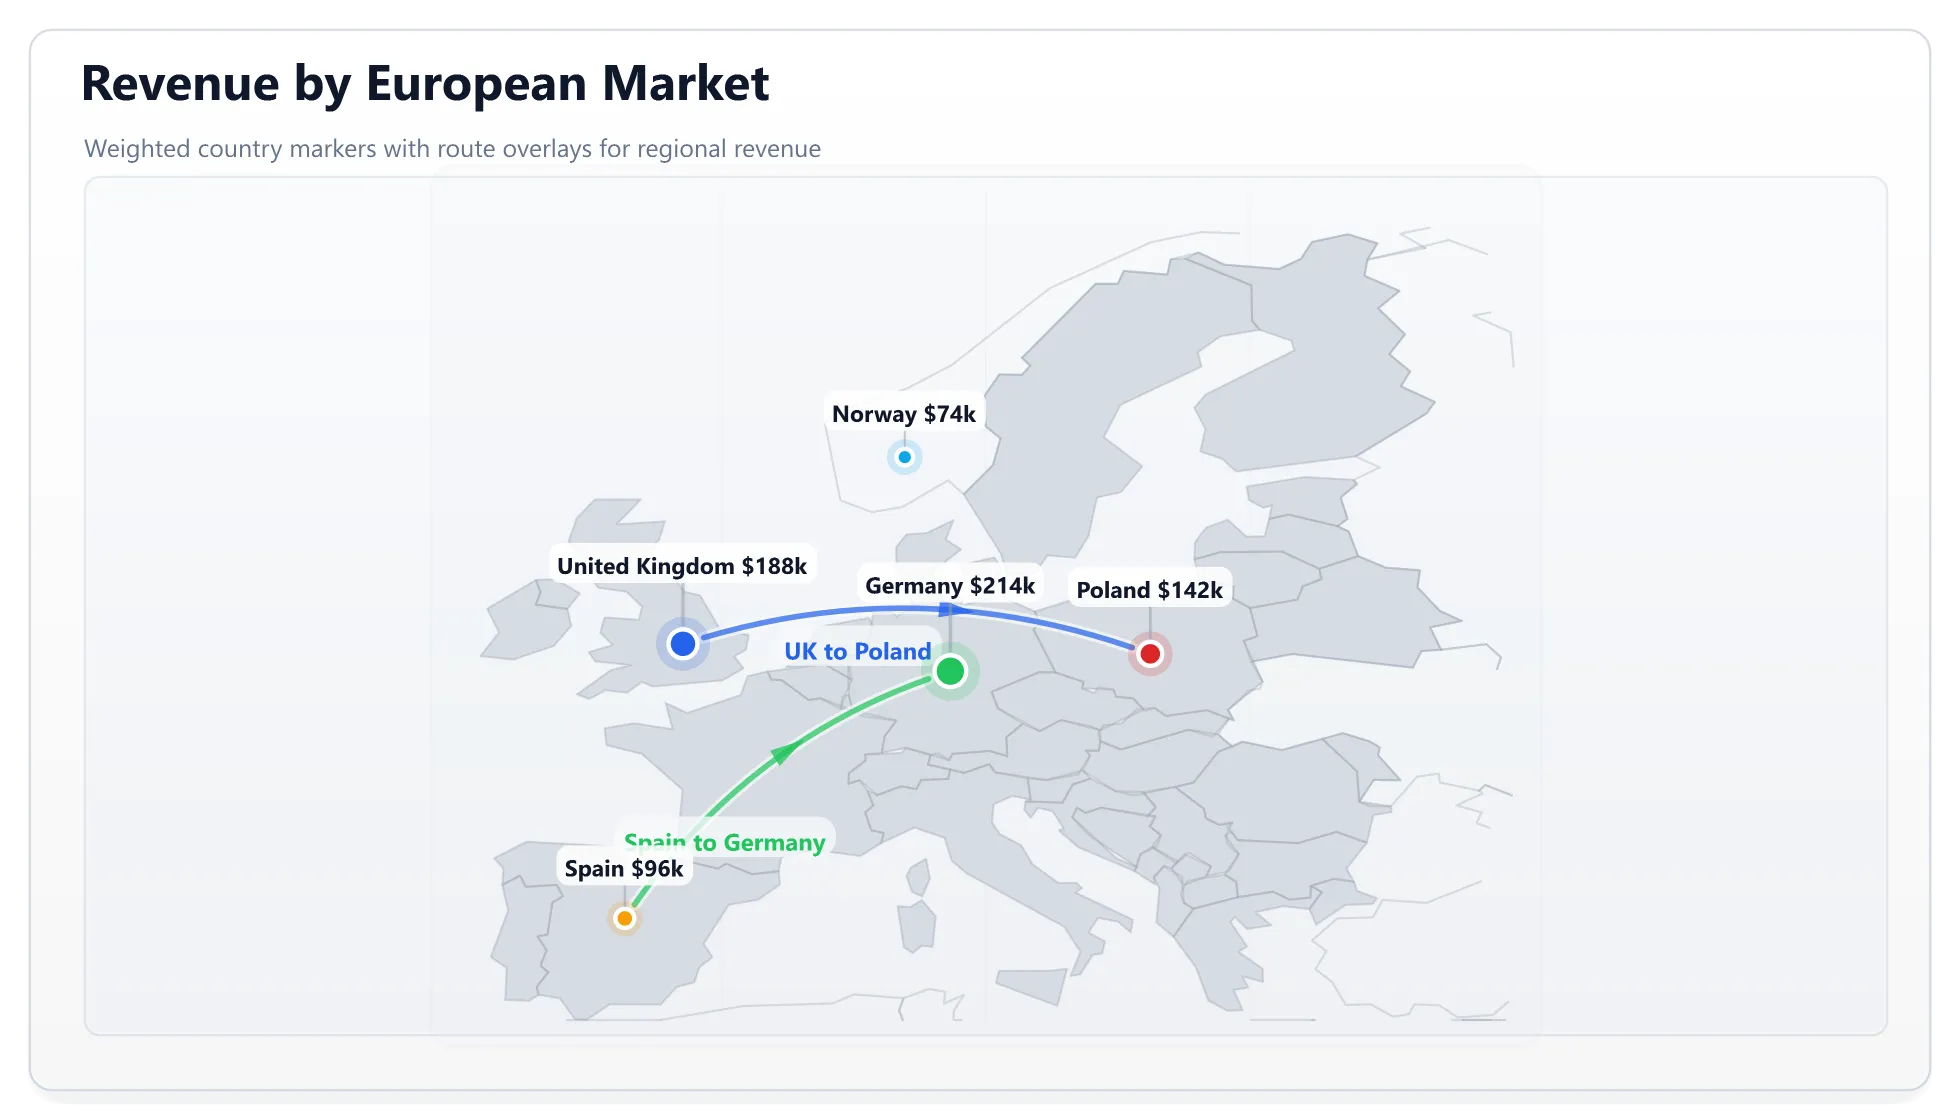 Enlarge image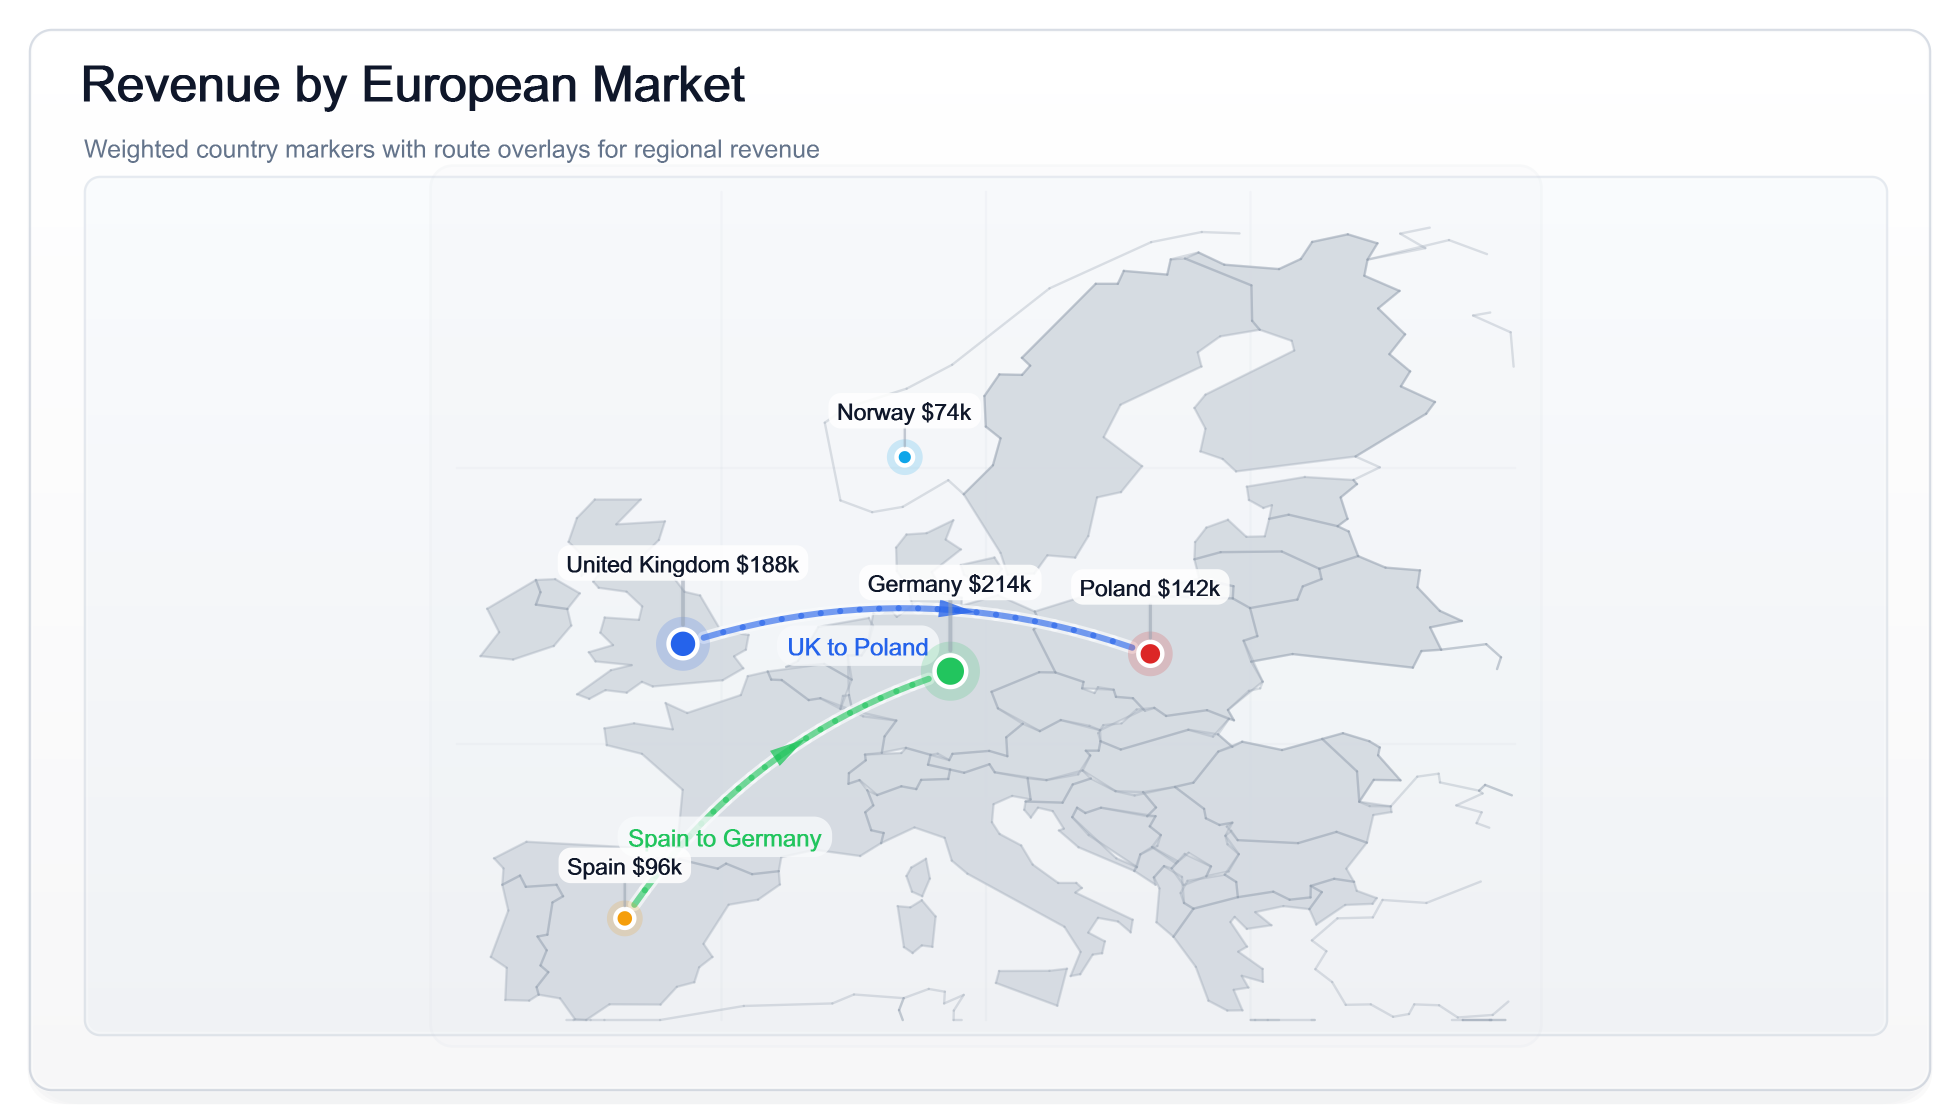
Maps
Europe revenue map
A dotted geographic map that encodes regional revenue with value-colored points, labels, and a report-oriented viewport.
- dotted map
- regional viewport
- value scale
- geographic labels

When to use it and how to rebuild it
Use it when: Add geographic context to business or operational metrics without loading a browser mapping library.
Entry: CreateEuropeRevenueDottedMap()
dotnet run --project .\ChartForgeX.Examples\ChartForgeX.Examples.csproj -c Release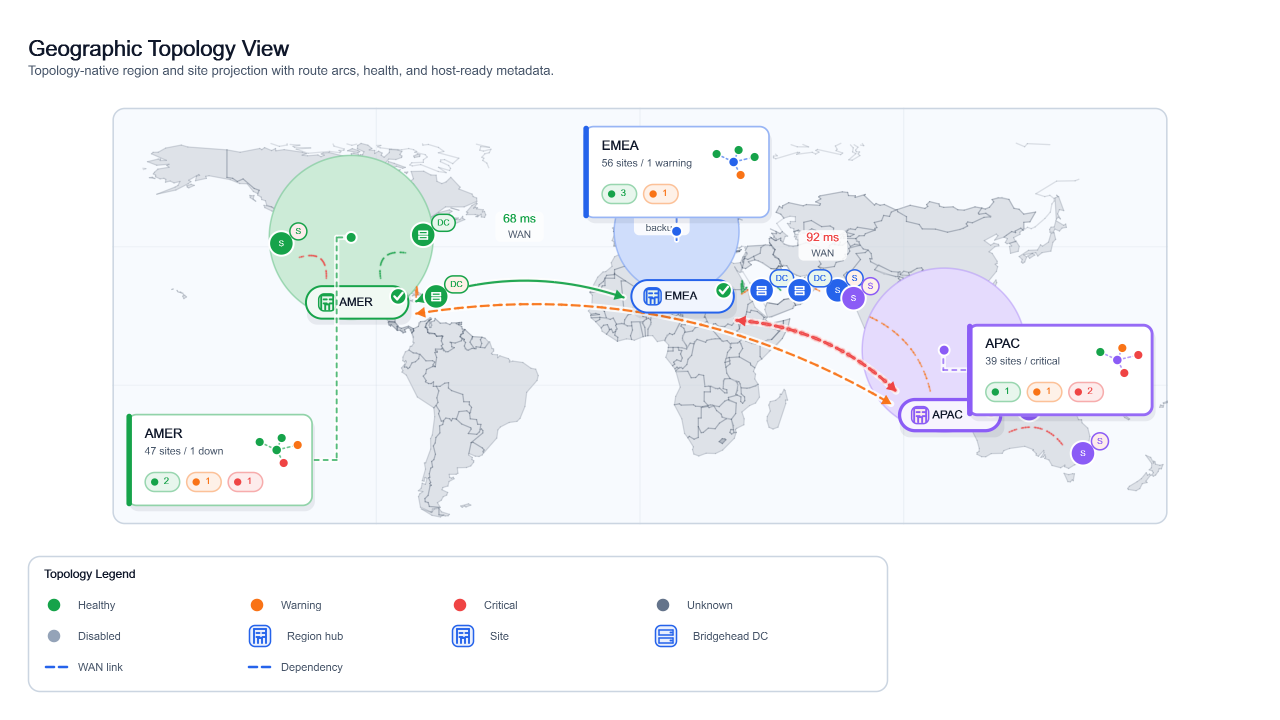 Enlarge image
Topology
Geographic infrastructure topology
A topology-native geographic layout with projected site markers, curved WAN routes, regional callouts, selection state, and metadata hooks.
- geographic topology
- WAN routes
- callouts
- selection metadata
When to use it and how to rebuild it
Use it when: Explain site connectivity and route health while keeping the output suitable for static reports and interactive HTML hosts.
Entry: BuildGeographicTopologyMap()
dotnet run --project .\ChartForgeX.Examples\ChartForgeX.Examples.csproj -c Release -- --topology-only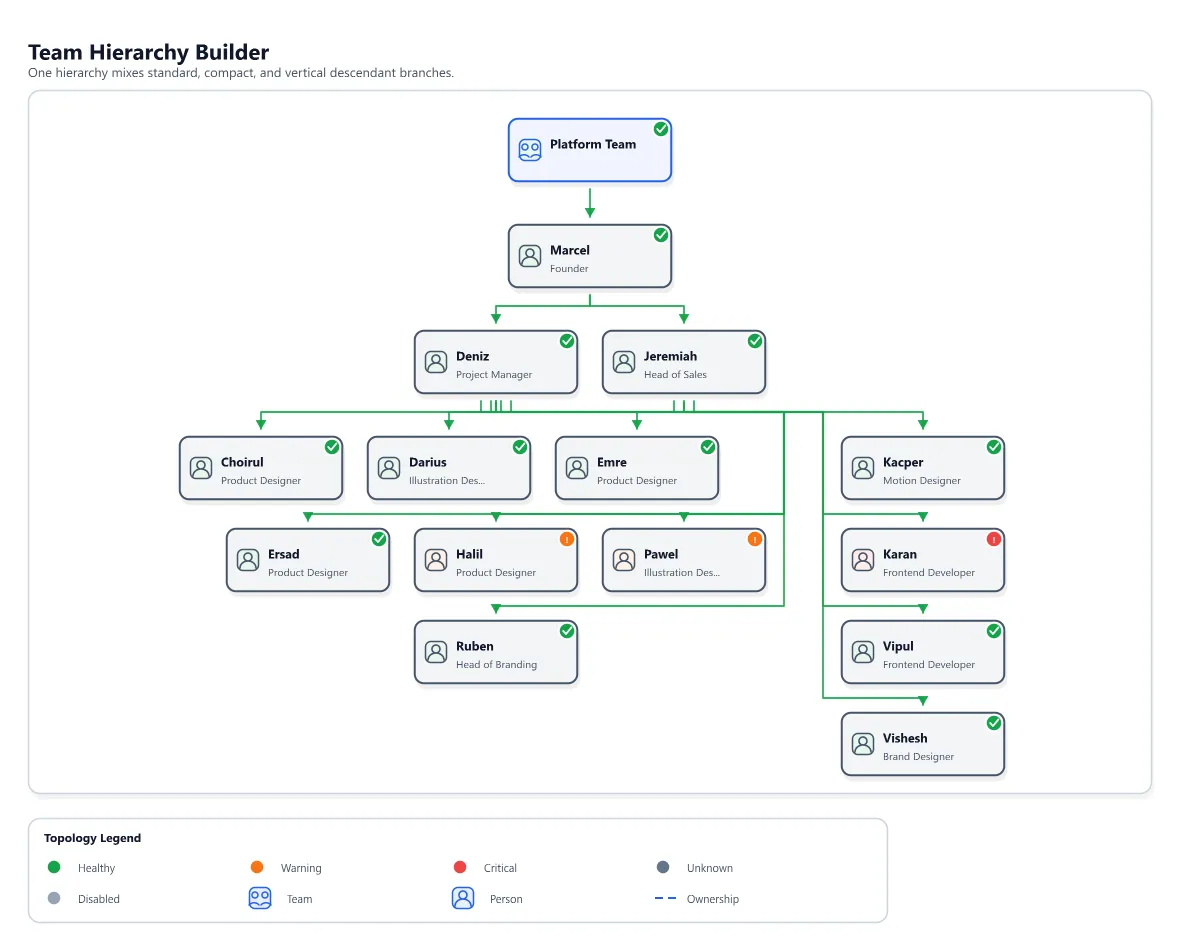 Enlarge image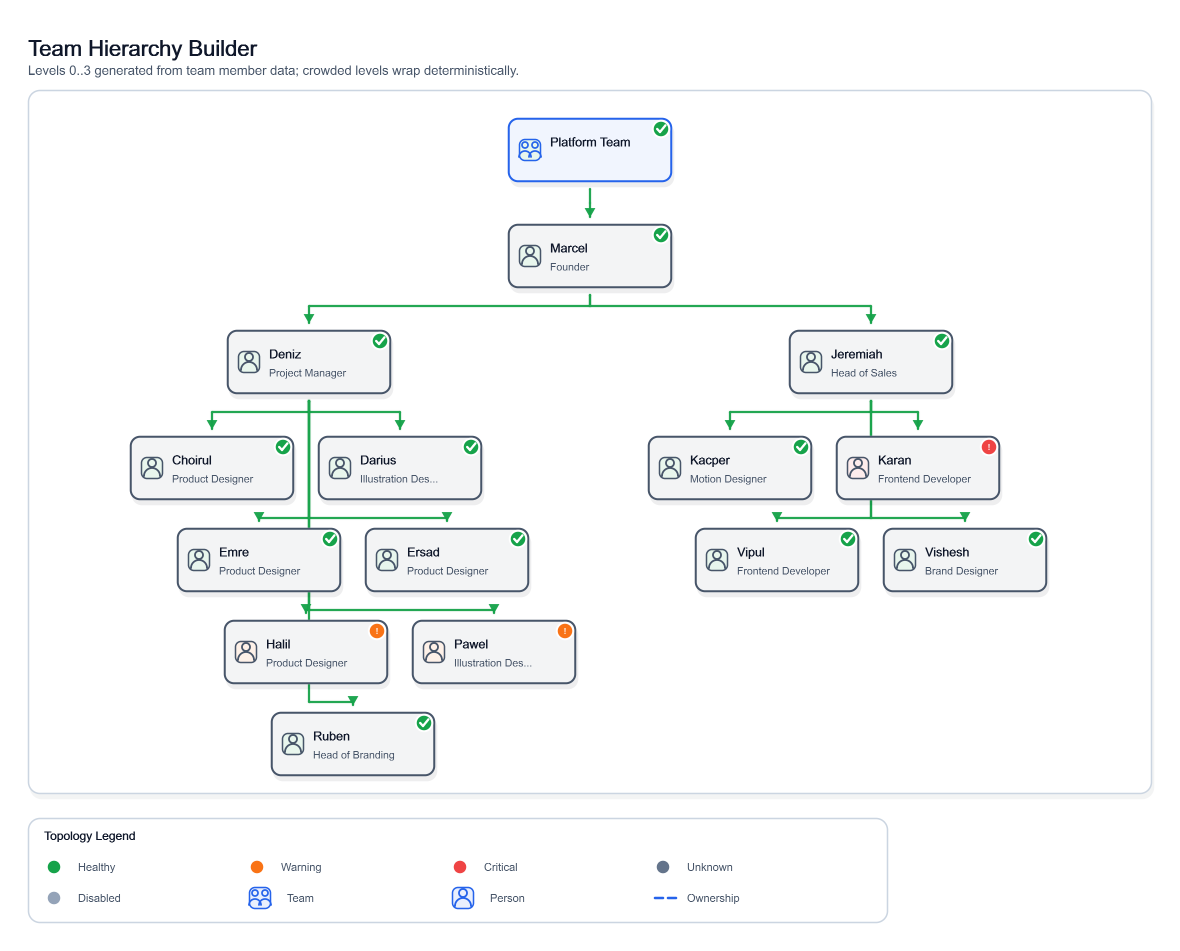
Topology
Organization hierarchy with branch policies
An organization chart generated from parent-child member data with standard, compact, and vertical layout policies applied to individual branches.
- organization chart
- subtree layout policy
- compact hierarchy
- deterministic routing

When to use it and how to rebuild it
Use it when: Render dense team or directory hierarchies while choosing the most readable layout for each subtree.
Entry: BuildTeamHierarchyBuilder()
dotnet run --project .\ChartForgeX.Examples\ChartForgeX.Examples.csproj -c Release -- --topology-only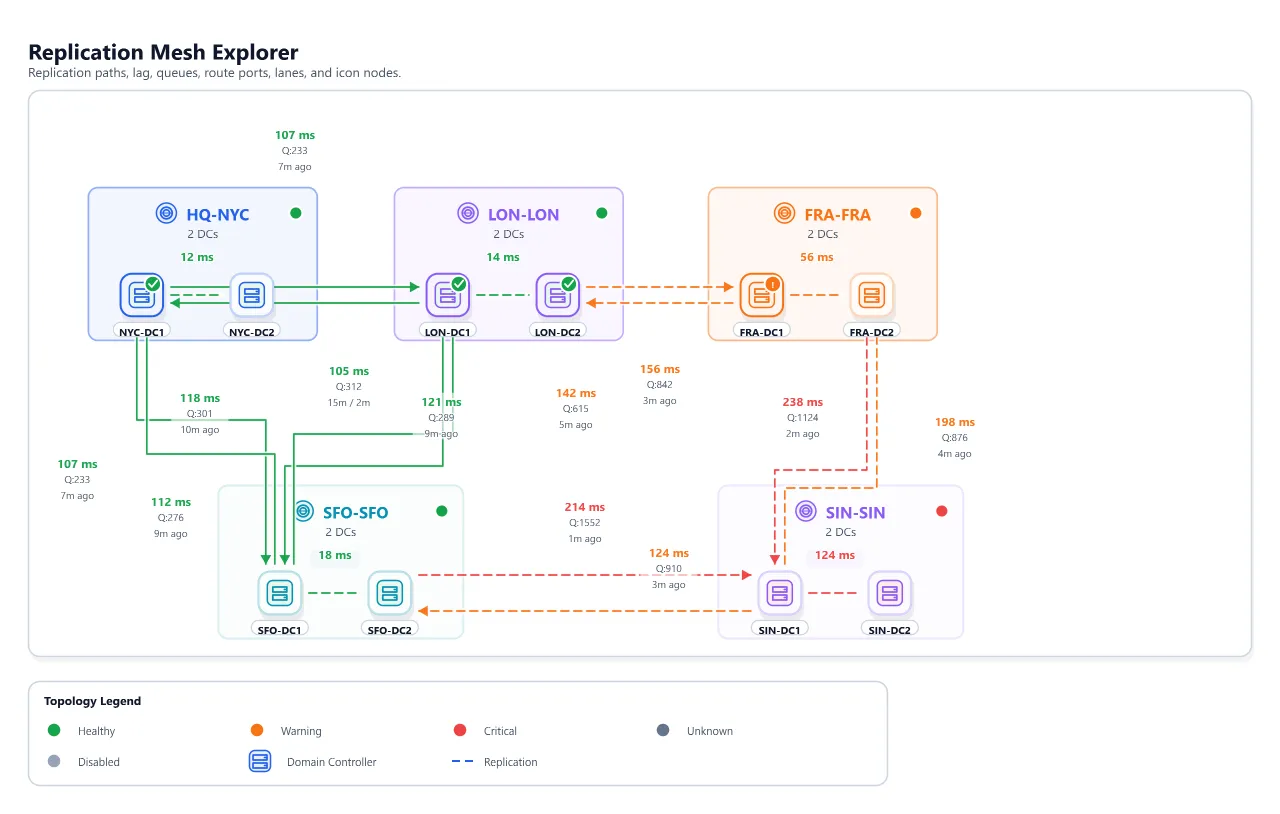 Enlarge image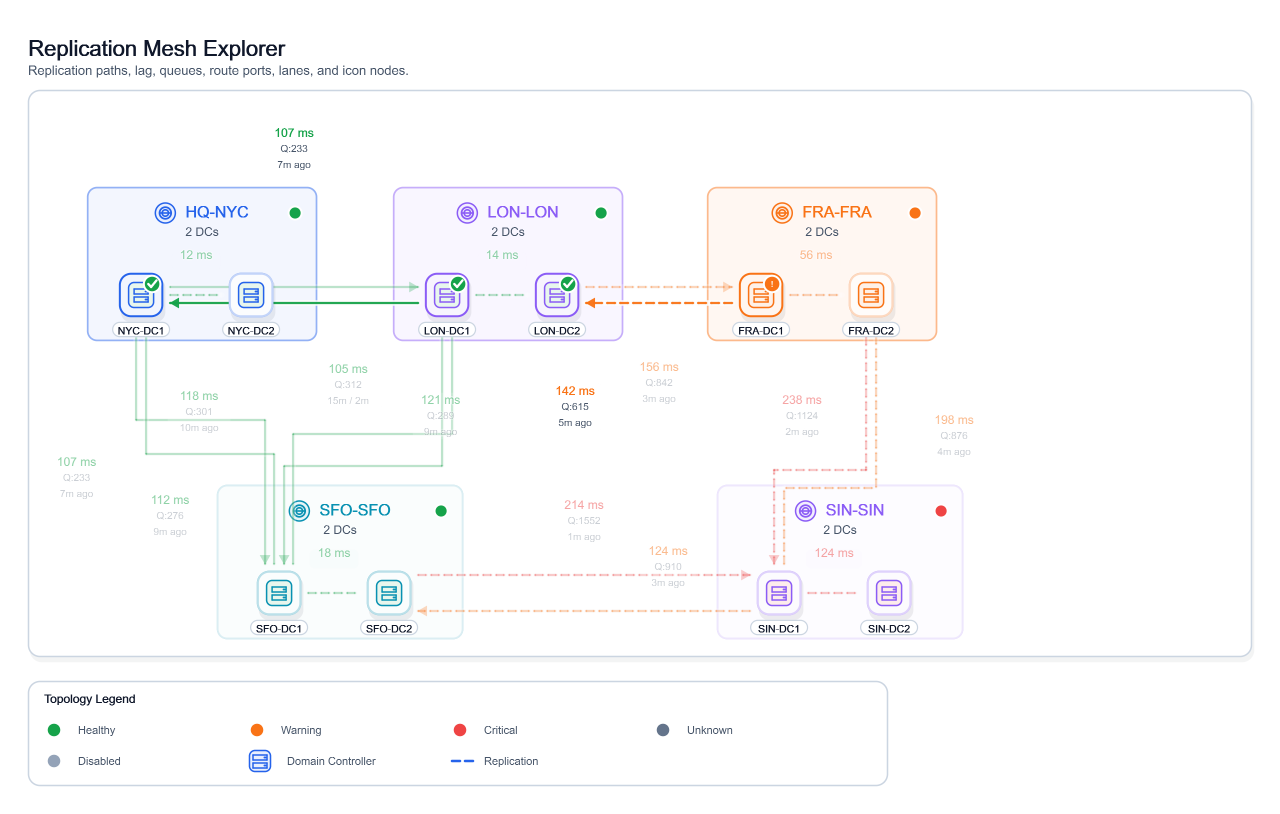
Topology
Interactive replication route explorer
A site-to-site replication mesh with selectable scenarios, ordered route steps, offender highlighting, scoped URL state, and host-ready events.
- interactive HTML
- scenario playback
- deep links
- host events

When to use it and how to rebuild it
Use it when: Start with the same deterministic topology used for SVG and PNG, then add browser-side exploration for incident review or live directory tooling.
Entry: BuildReplicationMeshExplorer()
dotnet run --project .\ChartForgeX.Examples\ChartForgeX.Examples.csproj -c Release -- --topology-only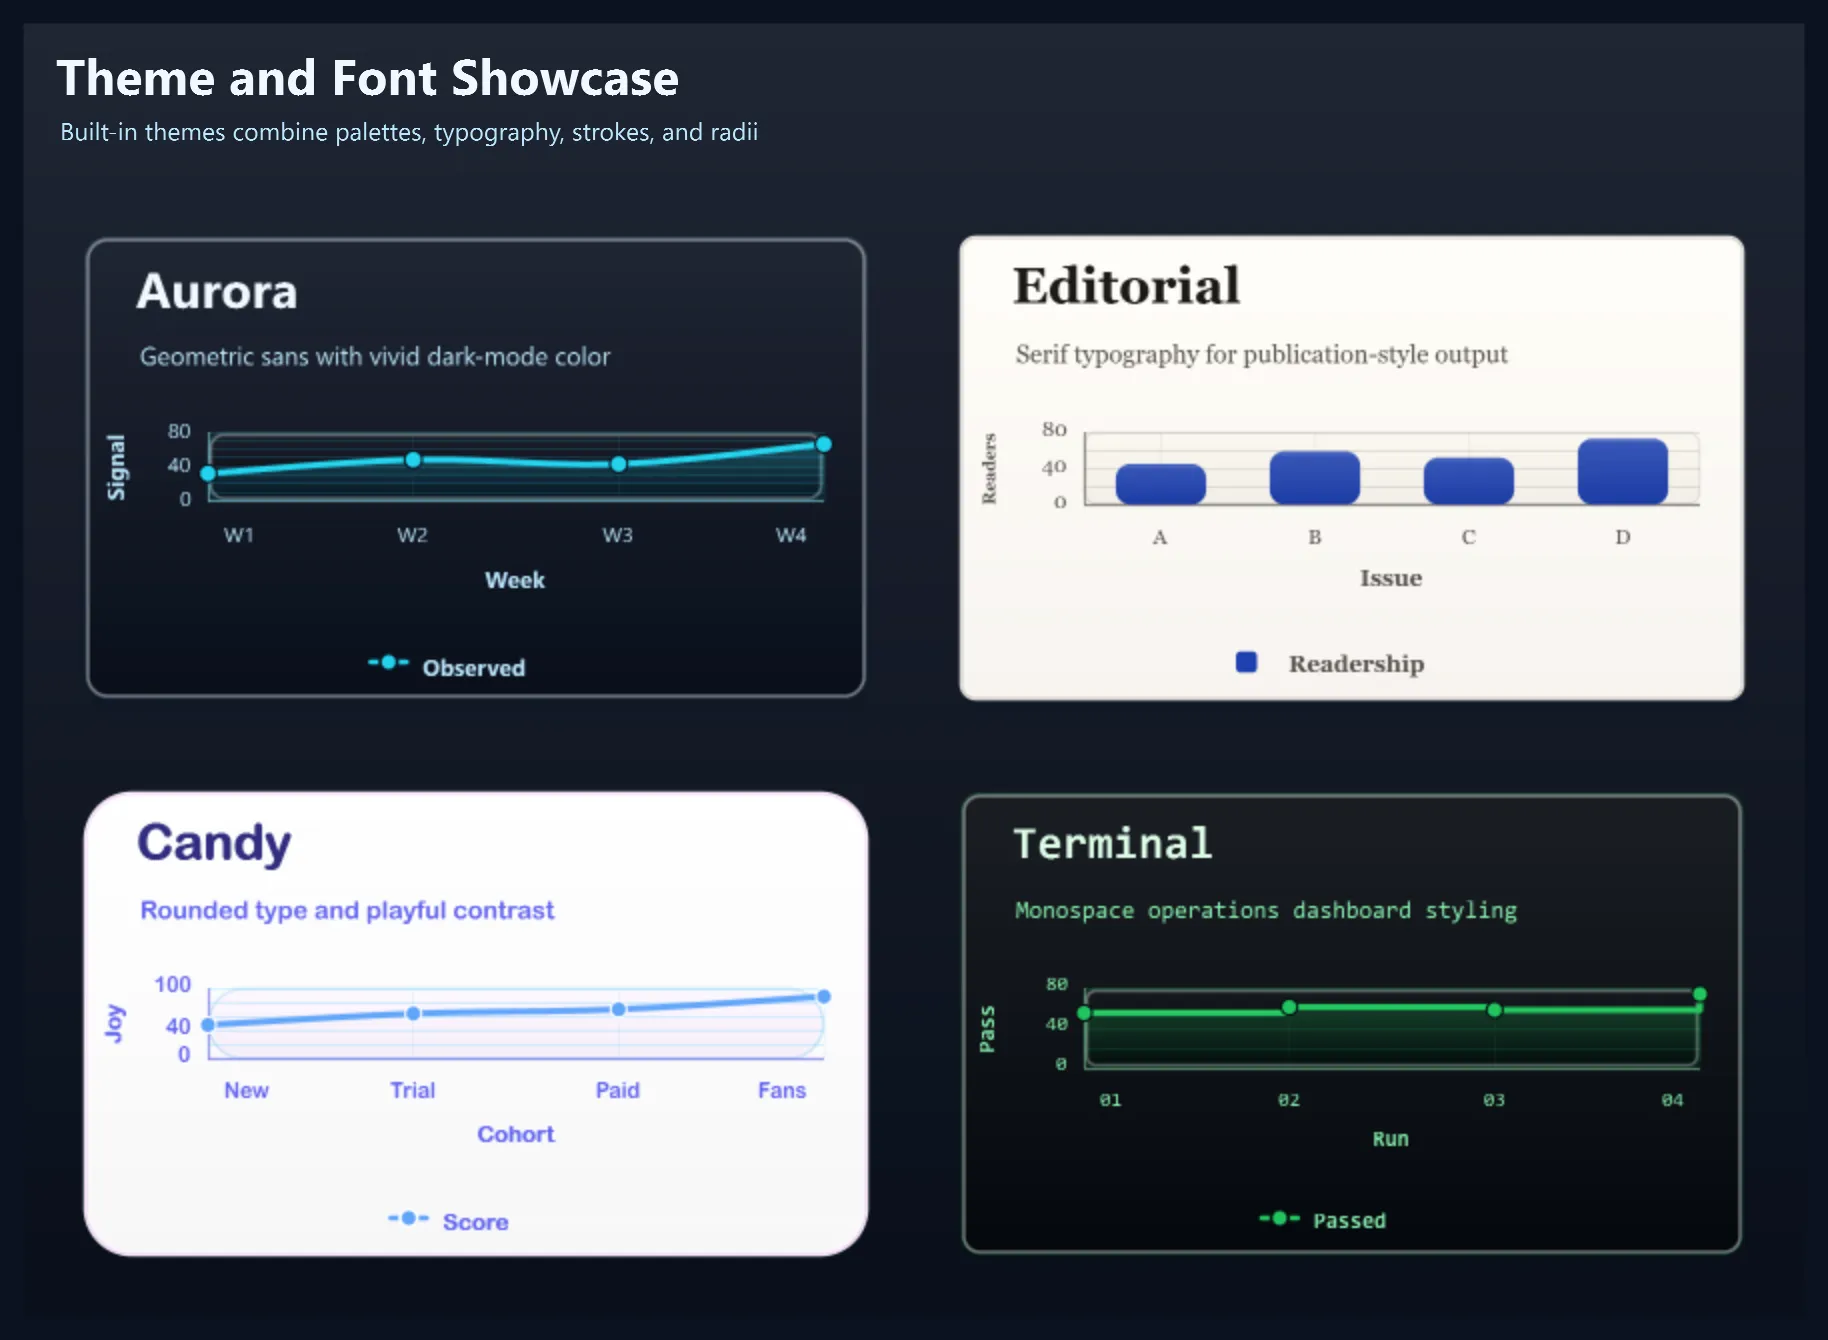 Enlarge image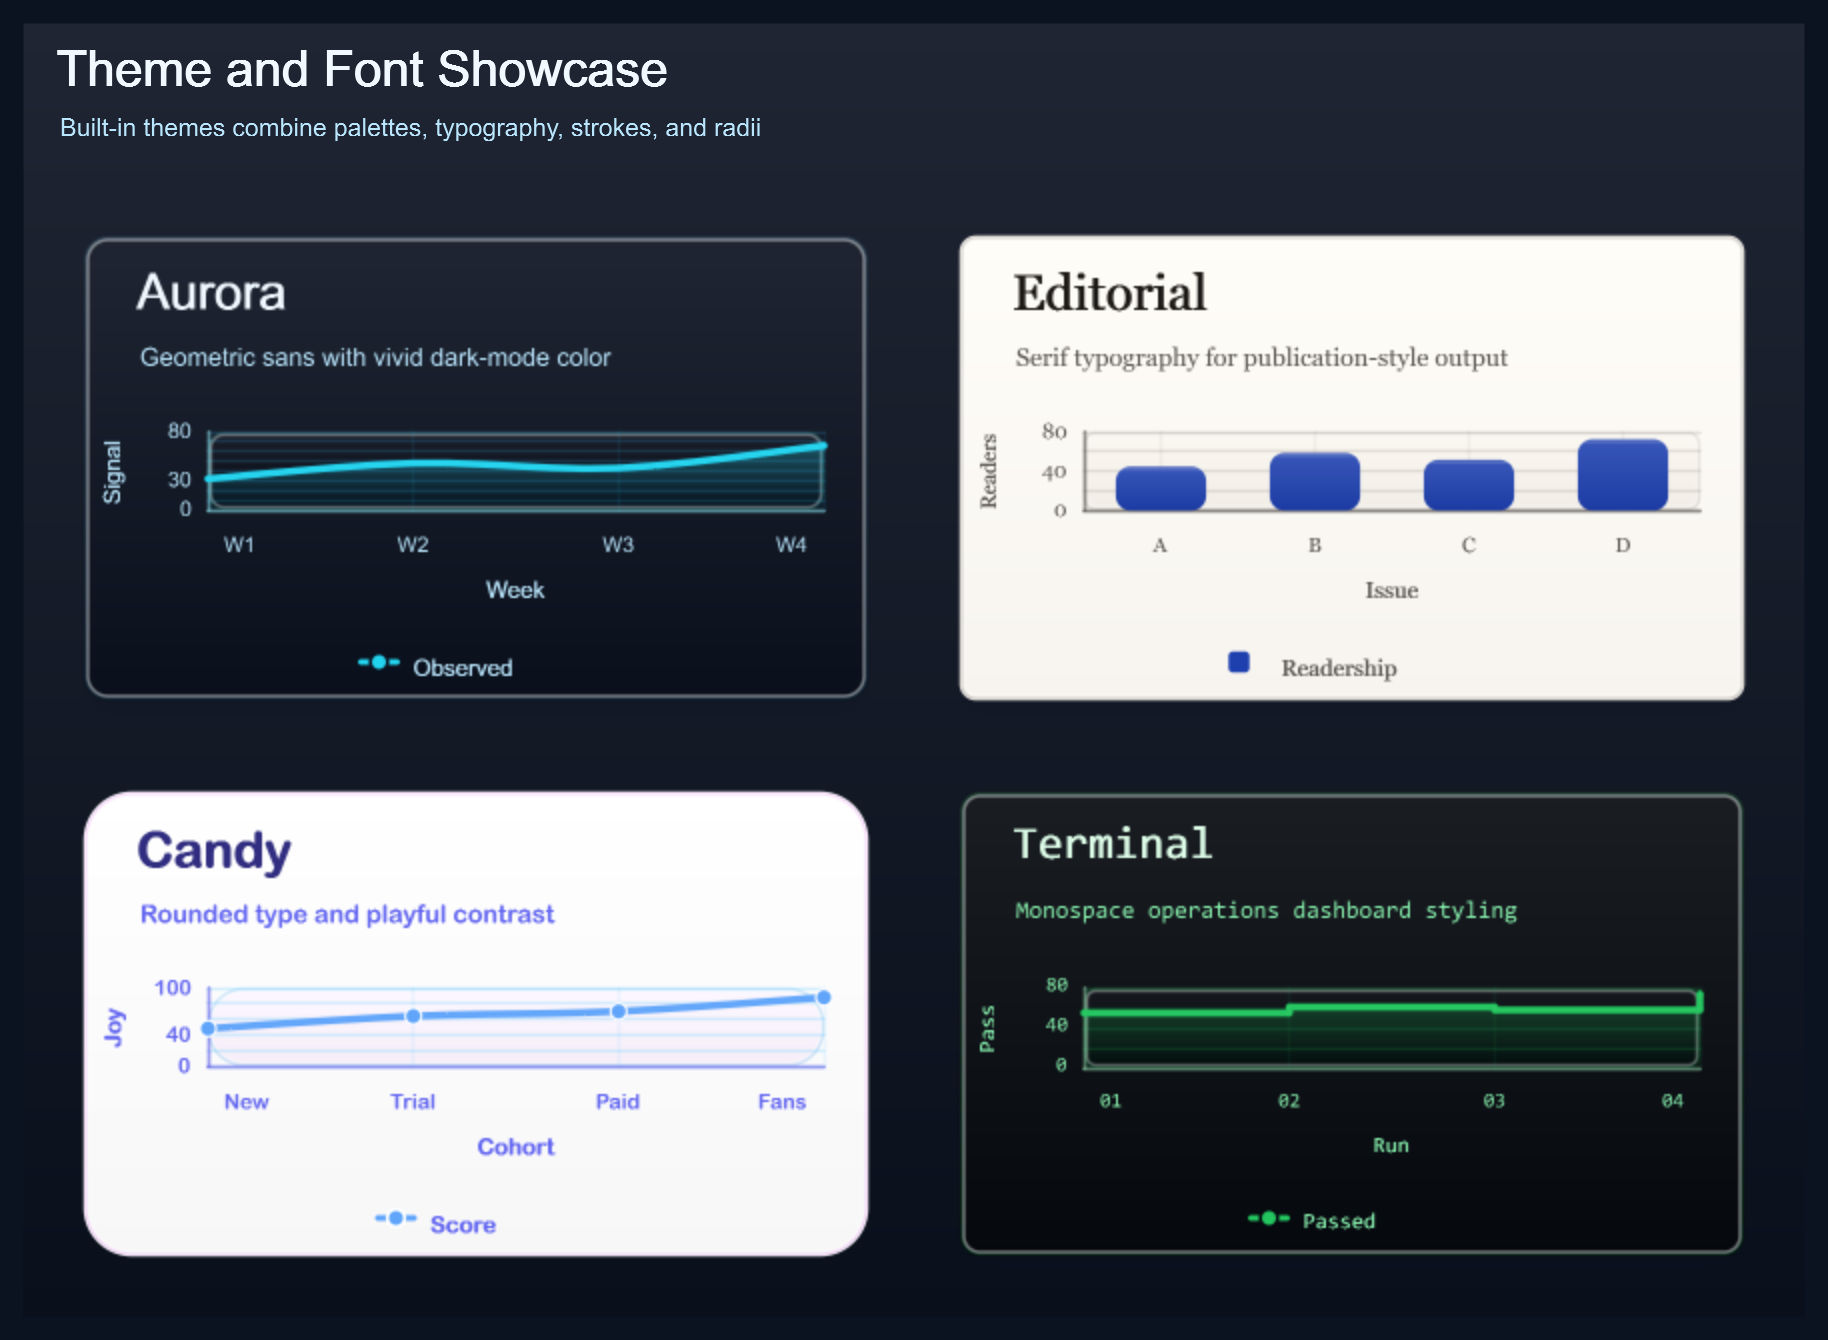
Visual systems
Theme and typography showcase
A single comparison grid demonstrating theme palettes, font choices, density, contrast, and consistent chart composition.
- themes
- typography
- comparison grid
- brand consistency

When to use it and how to rebuild it
Use it when: Choose and verify a visual system before applying it across dashboards, reports, documentation, or branded exports.
Entry: CreateThemeShowcaseGrid()
dotnet run --project .\ChartForgeX.Examples\ChartForgeX.Examples.csproj -c Release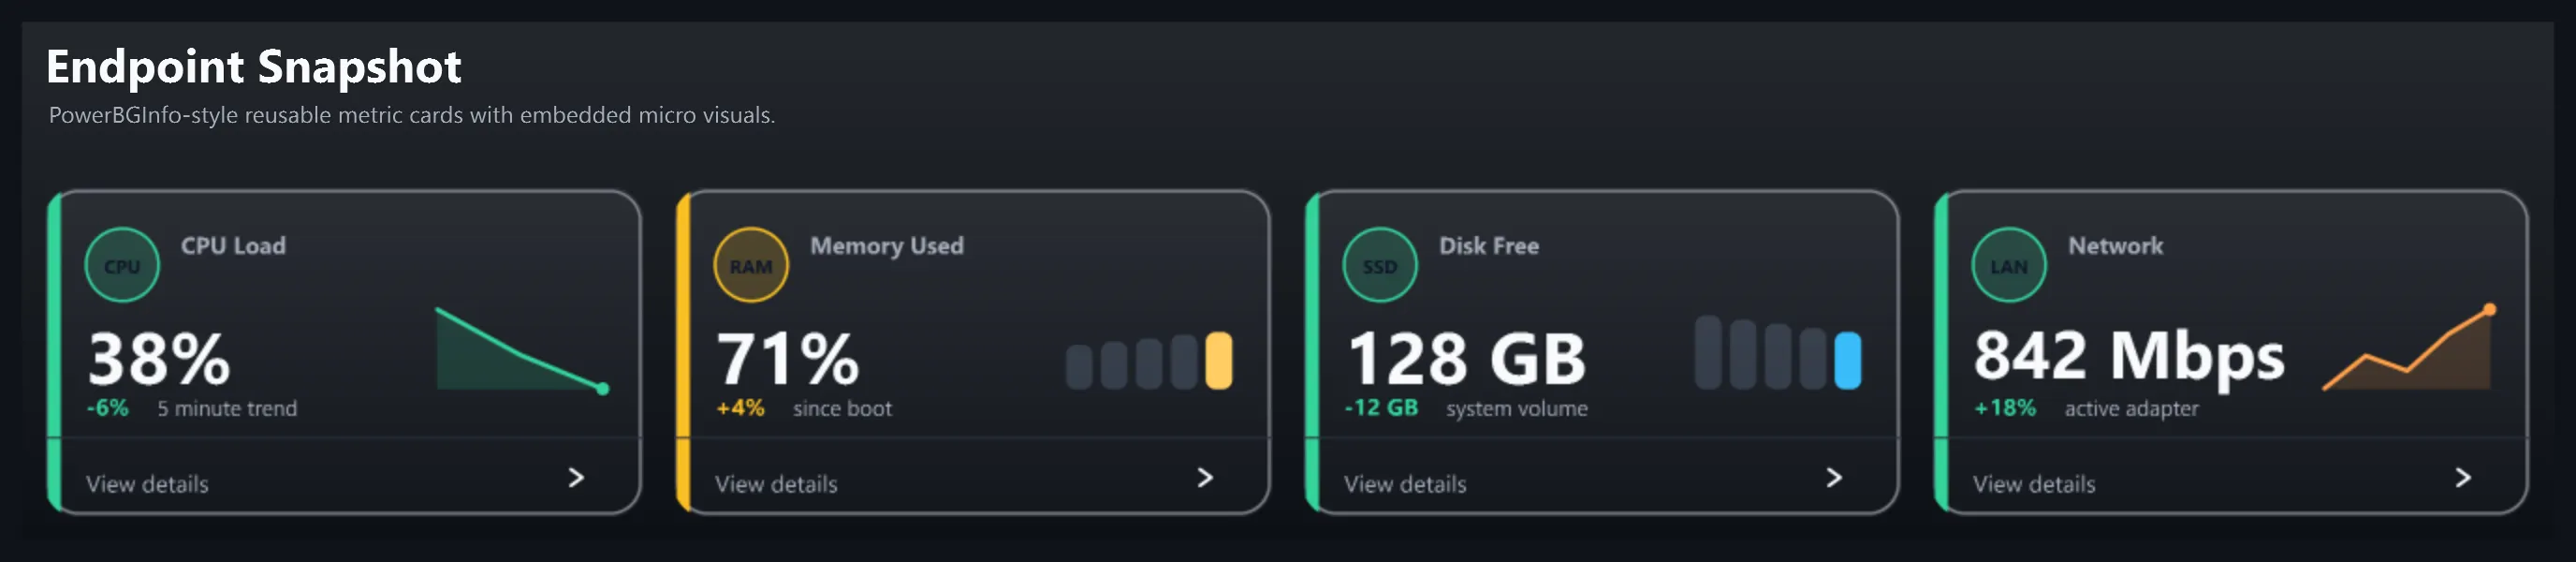 Enlarge image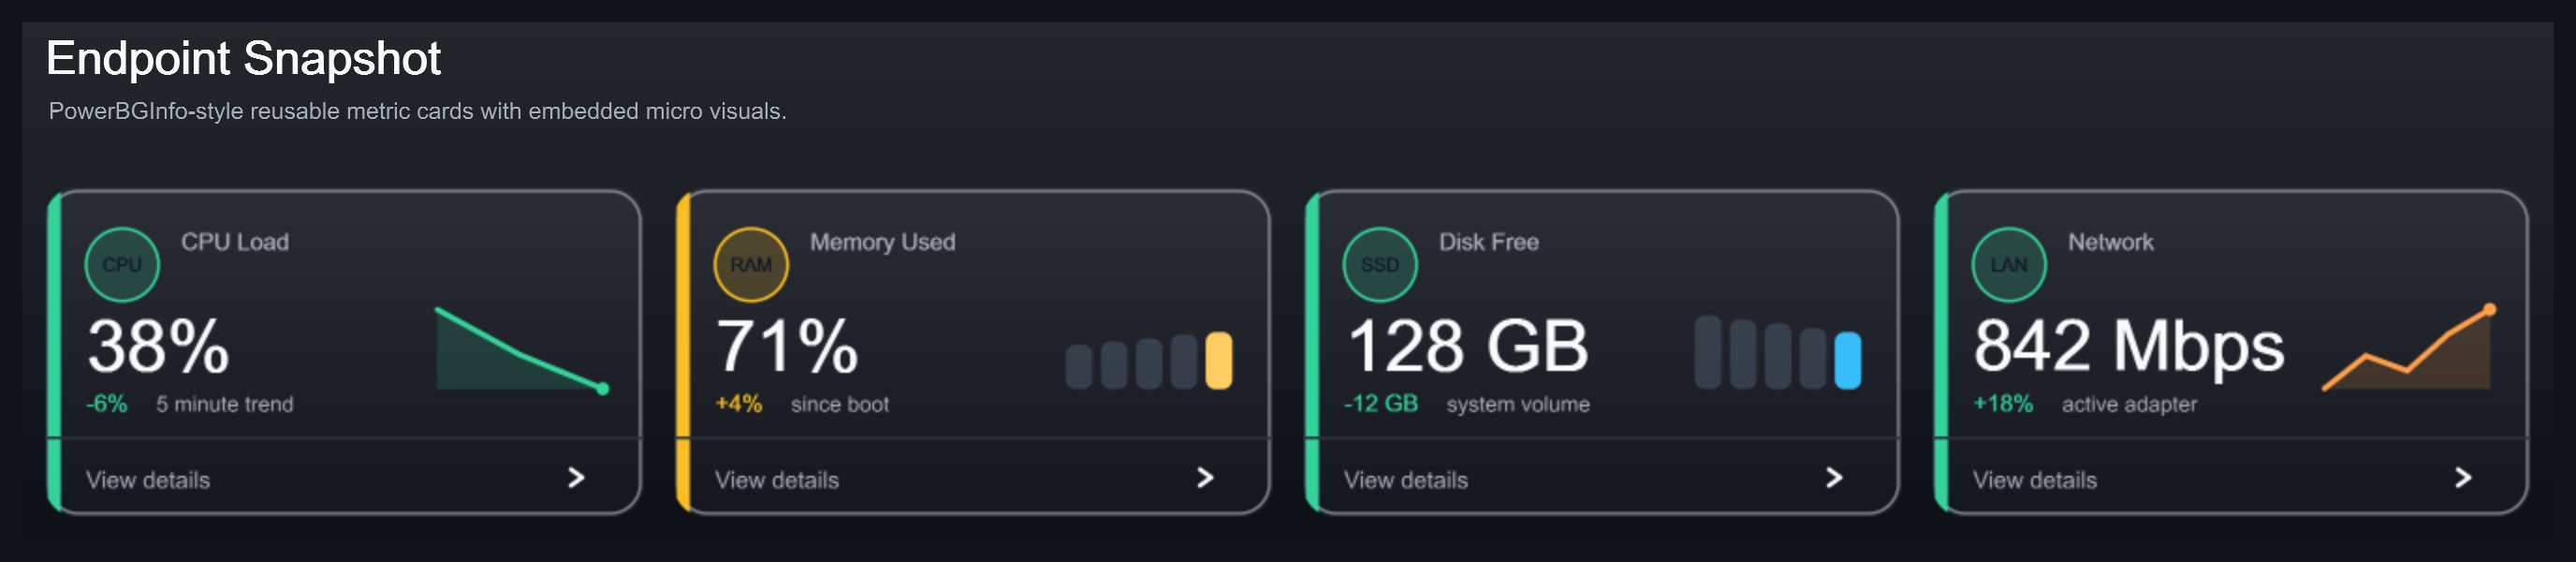
Dashboards
PowerBGInfo endpoint snapshot
A wide endpoint-status composition designed for Windows background deployment, combining device identity, health, storage, network, and support context.
- PowerBGInfo
- desktop background
- endpoint facts
- wide composition

When to use it and how to rebuild it
Use it when: Use ChartForgeX composition primitives through PowerBGInfo to place support-ready device context directly on managed Windows desktops.
Entry: SavePowerBgInfoStatsSection(output, outputScale)
dotnet run --project .\ChartForgeX.Examples\ChartForgeX.Examples.csproj -c ReleaseNo demos match those filters.