

blog
Build an Excel operational dashboard from PowerShell

I have seen many scripts create an Excel file and stop at the moment the rows appear. That is enough for a data export, but it is not yet a workbook I would give to an operations team. People need to know where to start, how to reach the detail, who owns the next action, and which values deserve attention.
This example builds that kind of workbook from PowerShell objects. It uses services, owners, health scores, incidents, trends, and remediation actions, matching the Word report in this series. The compact version creates six sheets with formulas, tables, validation, conditional formatting, charts, navigation, and a read-back check. The full showcase adds more data and print settings.
Before you start
Use PowerShell 7 and install the current public modules used for this article:
Install-Module PSWriteOffice -Scope CurrentUser -Force
Import-Module PSWriteOffice
Run the examples from a folder where you can write the generated files. Replace the sample service data after the first successful run.
Workbook shape
The full showcase script includes a larger dataset and more formatting. The blocks below build the smaller two-service workbook shown here.
It produces a workbook with these sheets:
Index: generated table of contents with links and backlinksSummary: KPI formulas and a status legend chartServices: the main operational tableTrend: month-by-month availability, incident, and automation dataOwner Summary: grouped ownership view for follow-upNotes: hidden generation notes for audit/debugging
I split the sheets by the questions people ask. Management starts with the summary, an engineer filters the service rows, and an owner can jump directly to the action queue or trend data.
Writing from objects
The workbook starts with normal PowerShell objects. In a real job, they could come from REST APIs, Microsoft Graph, monitoring probes, CSV files, Active Directory, or a previous PSWriteOffice read.
$services = @(
    [pscustomobject]@{
        Service = 'Identity Sync'
        Owner = 'Platform'
        Health = 98
        Incidents = 1
        Status = 'Healthy'
        Evidence = 'identity-sync'
    }
    [pscustomobject]@{
        Service = 'Remote Access'
        Owner = 'Security'
        Health = 76
        Incidents = 7
        Status = 'Risk'
        Evidence = 'remote-access'
    }
)

$trend = @(
    [pscustomobject]@{ Month = 'Jan'; Availability = 99.1; Incidents = 14; Automation = 62 }
    [pscustomobject]@{ Month = 'Feb'; Availability = 99.2; Incidents = 12; Automation = 66 }
    [pscustomobject]@{ Month = 'Mar'; Availability = 99.4; Incidents = 10; Automation = 71 }
    [pscustomobject]@{ Month = 'Apr'; Availability = 99.3; Incidents = 11; Automation = 74 }
    [pscustomobject]@{ Month = 'May'; Availability = 99.6; Incidents = 8;  Automation = 79 }
    [pscustomobject]@{ Month = 'Jun'; Availability = 99.7; Incidents = 6;  Automation = 83 }
)

$legend = @(
    [pscustomobject]@{ Status = 'Healthy'; Meaning = 'Stable service posture' }
    [pscustomobject]@{ Status = 'Watch';   Meaning = 'Owner follow-up required' }
    [pscustomobject]@{ Status = 'Risk';    Meaning = 'Immediate action required' }
)

$statusMix = $services |
    Group-Object Status |
    ForEach-Object { [pscustomobject]@{ Status = $_.Name; Count = $_.Count } }

$ownerSummary = $services |
    Group-Object Owner |
    ForEach-Object {
        [pscustomobject]@{
            Owner         = $_.Name
            Services      = $_.Count
            AverageHealth = [math]::Round(($_.Group | Measure-Object Health -Average).Average, 1)
            Incidents     = ($_.Group | Measure-Object Incidents -Sum).Sum
        }
    }

$path = '.\Operational-Dashboard.xlsx'
The script writes real Excel structure rather than decorating a flat export. Tables remain tables, formulas recalculate, hyperlinks work, and the operations team can keep editing the workbook after generation.
If a native table is all you need, start with the short pipeline:
$services | Export-OfficeExcel `
    -Path '.\ServiceHealth.xlsx' `
    -WorksheetName 'Services' `
    -TableName 'ServiceHealth' `
    -AutoFit `
    -FreezeTopRow
I move to the larger DSL only because this workbook needs several sheets, formulas, charts, validation, and navigation. For a single table, the short export above is the better script.
Where this fits next to ImportExcel
Many PowerShell users already have good reporting scripts built with ImportExcel. If one of those scripts creates the workbook you need, keep it. I use PSWriteOffice when Excel is part of a wider document workflow, when I need to inspect or repair workbook structure, or when the same objects also feed Word, PowerPoint, PDF, CSV, or email output.
The PSWriteOffice repository has a public comparison and reproducible benchmark matrix. It runs equivalent workbook tasks side by side and validates the files. Treat those results as a starting point for your workload, rather than a reason to rewrite a report that already works.
Building the summary sheet
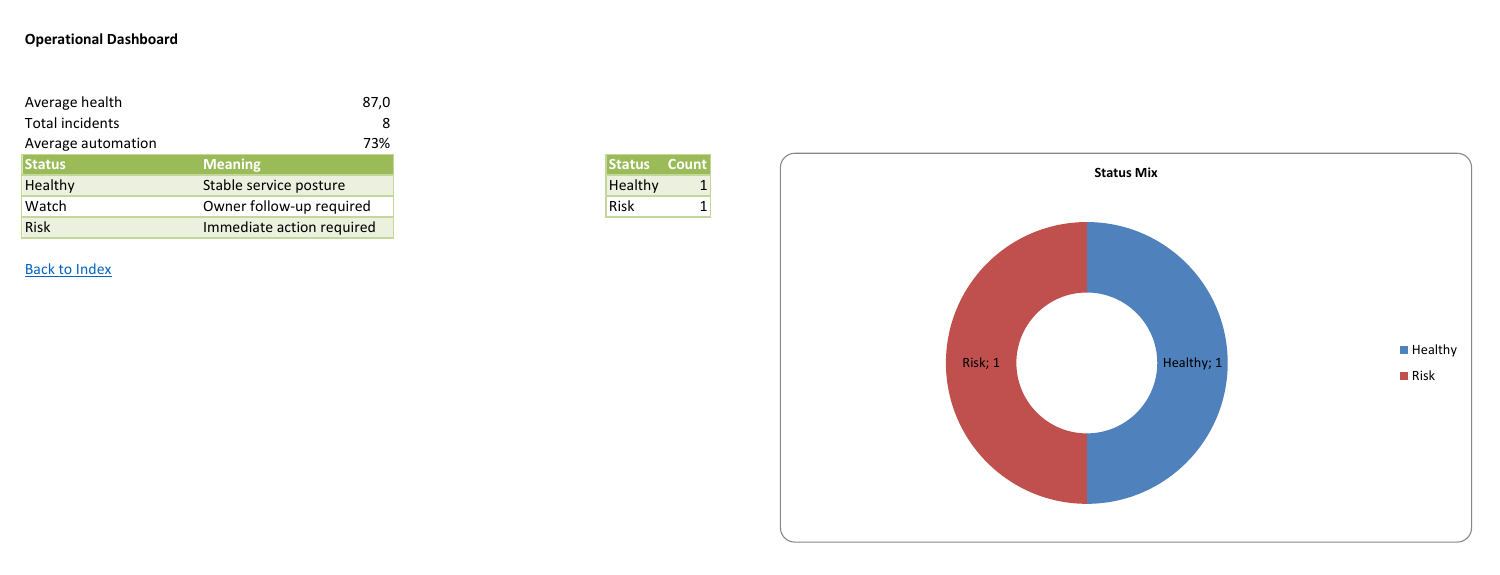
The summary sheet combines labeled formulas, styled tables, and a status chart.
$workbook = New-OfficeExcel -Path $path -NoSave

ExcelSheet -Document $workbook 'Summary' {
        ExcelRow -Row 1 -Values 'Operational Dashboard' -Bold $true
        ExcelCell -Address 'A4' -Value 'Average health'
        ExcelCell -Address 'A5' -Value 'Total incidents'
        ExcelCell -Address 'A6' -Value 'Average automation'
        ExcelCell -Address 'B4' -Formula 'AVERAGE(Services!B2:B3)' -NumberFormat '0.0'
        ExcelCell -Address 'B5' -Formula 'SUM(Services!C2:C3)'
        ExcelCell -Address 'B6' -Formula 'AVERAGE(Trend!D2:D7)/100' -NumberFormat '0%'

        ExcelTable -Data $legend `
            -TableName 'StatusLegend' `
            -StartRow 7 `
            -StartColumn 1 `
            -TableStyle 'TableStyleMedium4' `
            -AutoFit

        ExcelTable -Data $statusMix `
            -TableName 'StatusMix' `
            -StartRow 7 `
            -StartColumn 6 `
            -TableStyle 'TableStyleMedium4' `
            -AutoFit

        ExcelChart -TableName 'StatusMix' `
            -Row 7 `
            -Column 9 `
            -Type Doughnut `
            -Title 'Status Mix' `
            -PassThru |
            Set-OfficeExcelChartLegend -Position Right -PassThru |
            Set-OfficeExcelChartDataLabels -ShowValue $true -ShowCategoryName $true -PassThru |
            Set-OfficeExcelChartStyle -StyleId 251 -ColorStyleId 10
}
The result is a normal .xlsx. It can be filtered, recalculated, charted, and edited in desktop Excel.
Detail sheet: where the work happens
The Services sheet is where the follow-up happens. It uses a structured table, a validation list, a color scale, data bars, traffic-light icons, and evidence links generated from a header.
ExcelSheet -Document $workbook 'Services' {
    ExcelTable -Data ($services | Select-Object Service, Health, Incidents, Owner, Status, Evidence) `
        -TableName 'ServiceHealth' `
        -StartRow 1 `
        -StartColumn 1 `
        -TableStyle 'TableStyleMedium9' `
        -AutoFit

    ExcelFreeze -TopRows 1
    ExcelValidationList -Range 'E2:E50' -Values 'Healthy','Watch','Risk'
    ExcelConditionalColorScale -Range 'B2:B3' -StartColor '#F8696B' -EndColor '#63BE7B'
    ExcelConditionalDataBar -Range 'C2:C3' -Color '#5B9BD5'
    ExcelConditionalIconSet -Range 'B2:B3' -IconSet ThreeTrafficLights1

    ExcelChart -Range 'A1:B3' `
        -Row 12 `
        -Column 1 `
        -Type BarClustered `
        -Title 'Service health score'

    ExcelUrlLinksByHeader `
        -Header 'Evidence' `
        -TableName 'ServiceHealth' `
        -UrlScript { param($text) "https://evotec.xyz/docs/$text" } `
        -TitleScript { param($text) "Open $text" }
}
This is what I want from PowerShell-generated Excel: repeatable input data and a workbook that still feels normal when a person opens it.
Trend and ownership
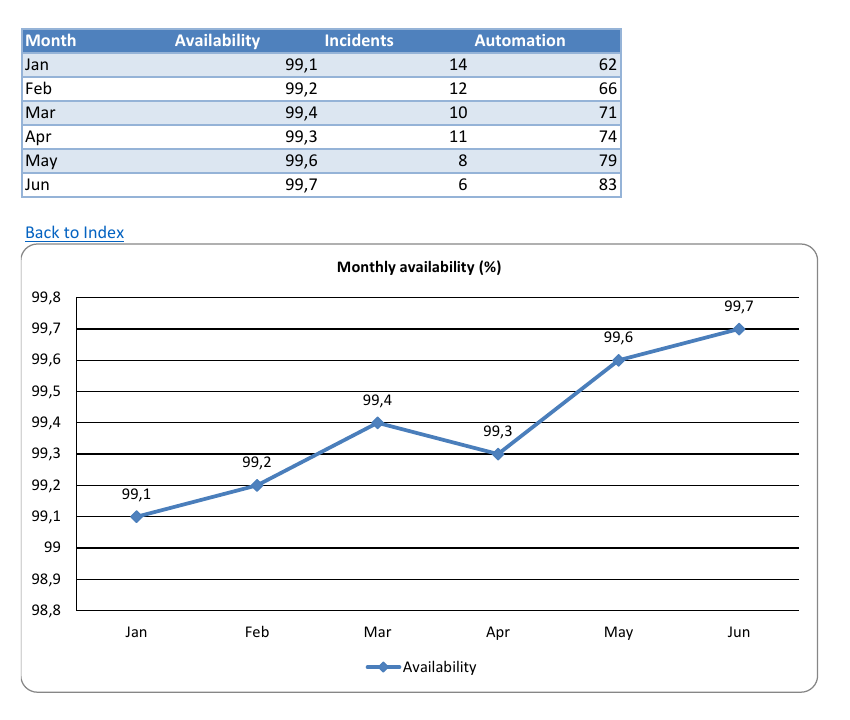
I add separate trend and owner-summary sheets so the workbook can answer two different questions: "what changed?" and "who needs to act?"
ExcelSheet -Document $workbook 'Trend' {
    ExcelTable -Data $trend -TableName 'TrendData' -TableStyle 'TableStyleMedium2' -AutoFit
    foreach ($column in 1..4) { ExcelColumn -Column $column -Width 16 }

    ExcelChart -Range 'A1:B7' `
        -Row 10 `
        -Column 1 `
        -Type Line `
        -Title 'Monthly availability (%)' `
        -PassThru |
        Set-OfficeExcelChartLegend -Position Bottom -PassThru |
        Set-OfficeExcelChartDataLabels -ShowValue $true -Position Top -PassThru |
        Set-OfficeExcelChartStyle -StyleId 251 -ColorStyleId 10
}

ExcelSheet -Document $workbook 'Owner Summary' {
    ExcelTable -Data $ownerSummary -TableName 'OwnerSummary' -TableStyle 'TableStyleMedium5' -AutoFit
    ExcelConditionalDataBar -Range 'D2:D20' -Color '#ED7D31'
    ExcelConditionalIconSet -Range 'C2:C20' -IconSet ThreeTrafficLights1
}
The trend chart shows availability alone. Mixing percentages and incident counts on one axis made the chart harder to read. The owner summary stays a table because reviewers need an action queue. When the analysis needs interactive regrouping, the companion Recipe-Excel-PivotAndSparklines.ps1 shows PivotTables and row-level trends in a smaller script.
Hidden notes and navigation
The hidden Notes sheet keeps generation details with the workbook without putting them in front of every reader. Once all content sheets exist, I generate navigation, save, and close the live workbook.
ExcelSheet -Document $workbook 'Notes' {
    ExcelCell -Address 'A1' -Value 'Generation Notes'
    ExcelCell -Address 'A2' -Value 'This sheet is hidden and carries audit/debugging inputs.'
    ExcelCell -Address 'A5' -Value 'Source'
    ExcelCell -Address 'B5' -Value 'Examples/Showcase/Showcase-Excel-OperationalDashboard.ps1'
    ExcelSheetVisibility -Hide
}

ExcelTableOfContents `
    -Document $workbook `
    -SheetName 'Index' `
    -IncludeNamedRanges `
    -AddBackLinks `
    -BackLinkText 'Back to Index'

$workbook | Close-OfficeExcel -Save
Reading and proving the workbook shape
After saving, I reopen the workbook and check the structure readers rely on.
$workbook = Get-OfficeExcel -Path $path -ReadOnly
$sheets = @($workbook.Sheets)
$summary = [pscustomobject]@{
    SheetCount = $sheets.Count
    TableCount = @(Get-OfficeExcelTable -Document $workbook).Count
    ChartCount = ($sheets | ForEach-Object { $_.Charts.Count } | Measure-Object -Sum).Sum
}
$sheetSummary = $sheets |
    Select-Object Name, UsedRangeA1, @{ Name = 'ChartCount'; Expression = { $_.Charts.Count } }
$workbook | Close-OfficeExcel

$summary
$sheetSummary
For the generated dashboard, the shape check reports:
- 6 sheets
- 6 tables
- 3 charts
The generated workbook also includes navigation links, evidence links, and a hidden notes sheet for audit context.
Those counts are useful in CI and give me a quick description of the workbook without opening Excel.
For data-level checks, the same workbook can be read back with range and table readers:
$serviceRows = Get-OfficeExcelRange `
    -Path $path `
    -Sheet 'Services' `
    -Range 'A1:H9'

$usedRange = Get-OfficeExcelUsedRange `
    -Path $path `
    -Sheet 'Services' `
    -AsDataTable

$namedRanges = Get-OfficeExcelNamedRange -Path $path
Now the script checks both the workbook shape and the values that matter.
From Windows events to a delivered report
The input objects can come from anywhere. In this example, a scheduled Windows operations job queries PSEventViewer, writes the detail to Excel, creates a compact PDF summary, and lets Mailozaurr deliver both files:
Import-Module PSEventViewer
Import-Module PSWriteOffice
Import-Module Mailozaurr

$outputDirectory = (New-Item -ItemType Directory -Path (Join-Path $PSScriptRoot 'Output') -Force).FullName
$excelPath = Join-Path $outputDirectory 'System-Events.xlsx'
$pdfPath = Join-Path $outputDirectory 'System-Events.pdf'

$events = @(
    Get-EVXEvent `
        -LogName System `
        -TimePeriod Last24Hours `
        -ReadMode Message `
        -MaxEvents 500 |
        Select-Object TimeCreated, MachineName, ProviderName, Id, LevelDisplayName, Message
)

$events | Export-OfficeExcel `
    -Path $excelPath `
    -WorksheetName Events `
    -TableName SystemEvents `
    -AutoFit `
    -FreezeTopRow

New-OfficePdf -Path $pdfPath {
    PdfHeading 'System event summary'
    PdfParagraph "Collected $($events.Count) events during the last 24 hours."
    PdfTable -InputObject ($events | Select-Object -First 25 TimeCreated, MachineName, ProviderName, Id, LevelDisplayName)
}

$mailCredential = Get-Secret -Name 'Operations-Smtp-Credential'
Send-EmailMessage `
    -From 'reports@example.com' `
    -To 'operations@example.com' `
    -Subject 'Daily Windows event report' `
    -Text 'The detailed Excel workbook and review PDF are attached.' `
    -Attachment $excelPath, $pdfPath `
    -Server 'smtp.example.com' `
    -Credential $mailCredential `
    -UseSsl
Each module has one job. PSEventViewer queries and projects the events, PSWriteOffice creates the workbook and PDF, and Mailozaurr handles authentication and delivery. They meet through ordinary PowerShell objects and file paths.
Get-Secret comes from Microsoft.PowerShell.SecretManagement. In a scheduled task or CI job, use the secret provider that environment already trusts instead of putting credentials in the report script.
Performance and scale
I build the dashboard around tables and ranges so the script does not format thousands of cells one by one through the pipeline.
- Use
ExcelTable -Data $objectsfor rectangular datasets. - Use formulas for values Excel should keep recalculating after the file is opened.
- Use table-based charts so the chart follows the data shape.
- Apply conditional formatting to ranges instead of formatting every cell in a loop.
- Keep read-back validation focused on summary counts, used ranges, table names, and critical values.
- Use hidden sheets for generation notes and audit metadata instead of writing separate sidecar files.
The repository benchmark suite covers objects, DataTable, IDataReader, report workbooks, append, update, charts, pivots, and read-back against alternatives that support the same task. I do not reduce that to one headline number because table size, types, AutoFit, charts, formulas, updates, and read-back all change the result. Run the scenario closest to your workload on the target machine and keep validation enabled.
For a larger inventory, split the visible sheets by workflow: summary, details, ownership, trend, and notes. Readers get smaller tables and clearer places to work.
Where I use the same layout
With different input objects, the same workbook shape can handle:
- inventory dashboards with asset detail, owner queue, and stale-data warnings
- security posture workbooks with risk scoring, evidence links, and action tracking
- migration trackers with validation lists, conditional formatting, and grouped owners
- service availability scorecards with trend charts and monthly snapshots
- workbook QA reports where read-back checks verify tables, charts, links, and hidden sheets
Check the final workbook where people will use it
The compact example uses ordinary tables for its owner queue. PivotTables and sparklines are separate options when readers need interactive regrouping or compact row-level trends; see the pivot and sparkline recipe.
Structural read-back confirms what is stored in the workbook. I also open representative reports in the spreadsheet application readers use, because recalculation, chart labels, and print layout are visual behavior. Availability and automation are percentages while incidents are counts, so keep them on separate charts or configure a secondary axis explicitly.