Discover new features in the PSWriteHTML PowerShell module – including New-HTMLInfoCard, improved layout controls with the -Density parameter, and customizable shadows for clean, modern dashboards and reports.
html
In today’s digital age, the ability to create compelling and informative HTML reports and documents is a crucial skill for professionals in various fields. Whether you’re a data analyst, a system administrator, a developer, or simply someone who wants to present information in an organized and visually appealing manner, having the right tools at your disposal can make all the difference. That’s where the PSWriteHTML PowerShell module steps in, offering an array of possibilities to suit your reporting needs.
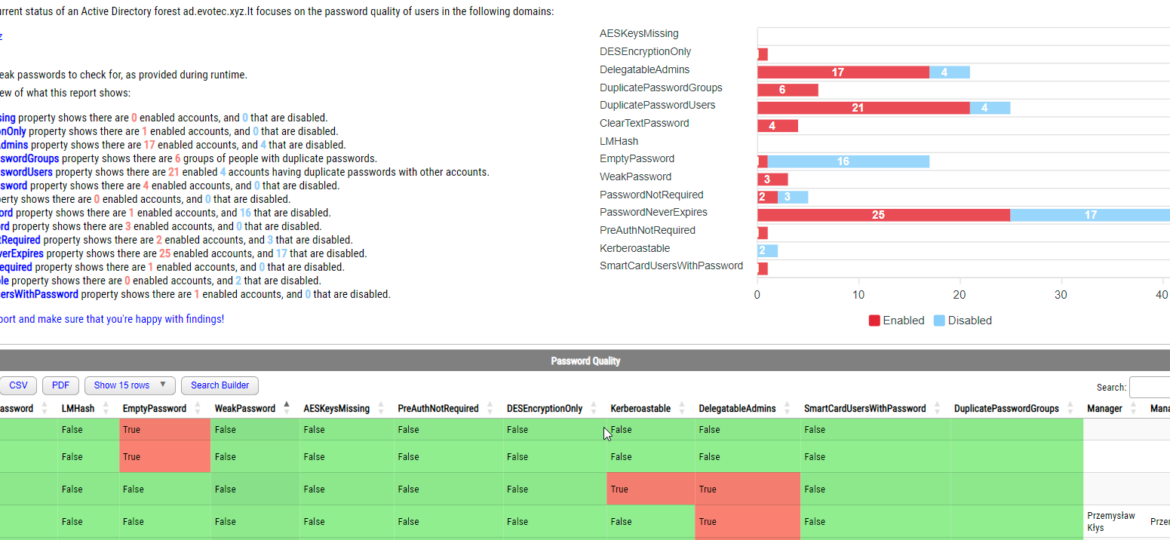
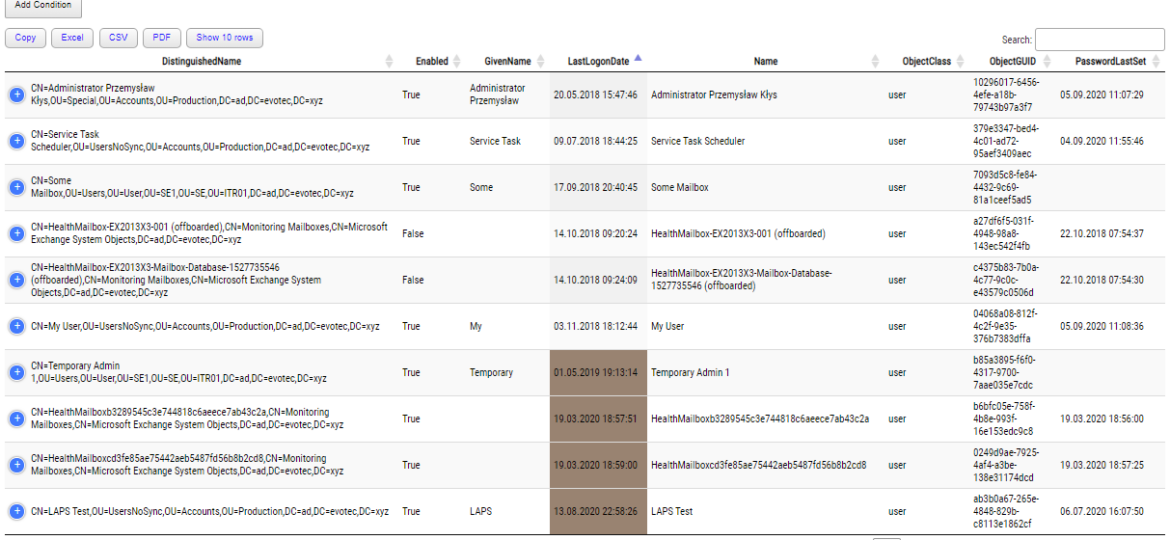
PasswordSolution uses the DSInternals PowerShell module to gather Active Directory hashes and then combines that data into a prettified report. If you have ever used DSInternals, you know that while very powerful, it comes with raw data that is hard to process and requires some skills to get it into a state that can be shown to management or security.
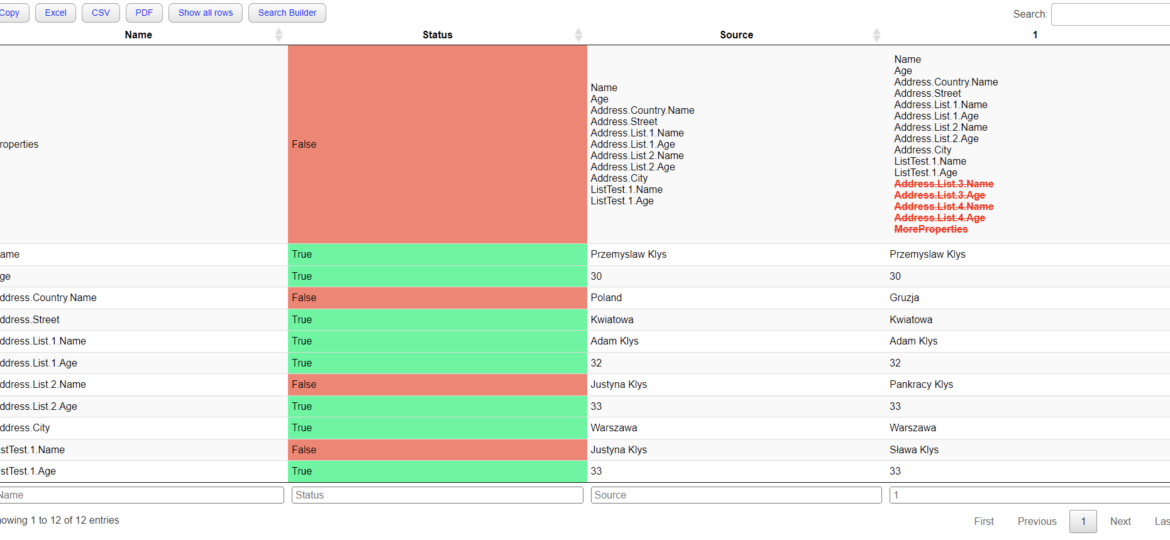
Two years ago, I wrote a blog post on how you can compare two or more objects visually in PowerShell that works on Windows, Linux, or macOS. I’ve been using that for a while, but it had a specific flaw. Comparing more advanced objects that you often see (for example, returned by Graph API, two config files) wasn’t working correctly, often throwing errors. The reason for this was that having nested hashtables arrays require more advanced logic. Today I’ve updated my module to use the ConvertTo-FlatObject function, which allows the Compare-MultipleObjects function to compare suitably more advanced objects hopefully. Of course, it should not throw errors anymore.
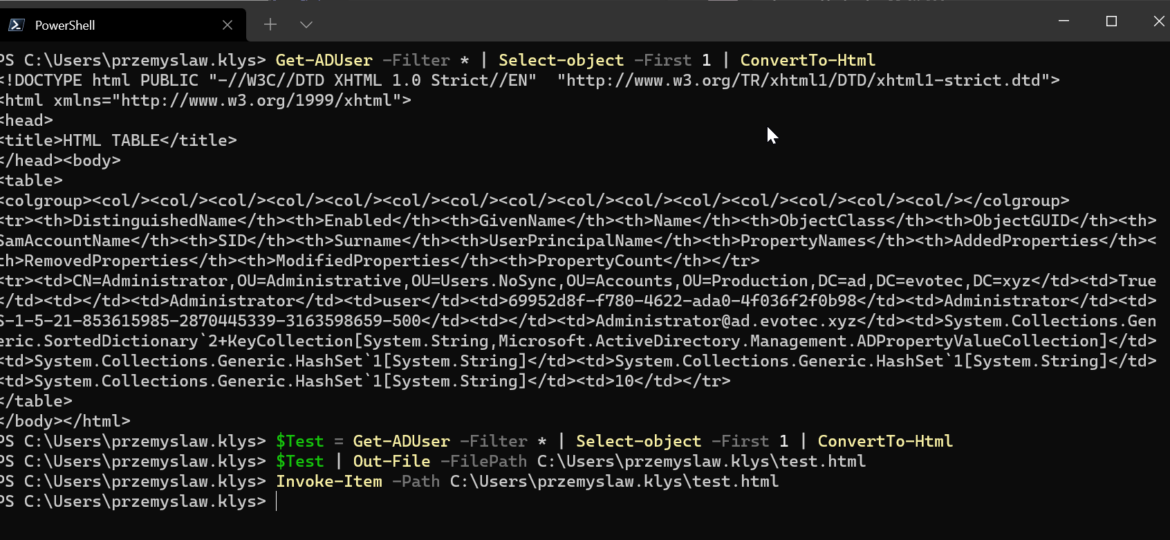
One of the everyday use cases with PSWriteHTML is to create a simple view of PowerShell data in a table. While PowerShell comes with a built-in cmdlet ConvertTo-Html, it’s basic in its functionality. It makes an HTML representation of PowerShell data, but it brings no CSS, JavaScript, or other functionality. While for some use cases, it’s enough, the other times, you need to make an effort to make it usable.
I’ve been using HTML reporting in PowerShell for a while. Initially, I would usually build HTML by hand, but the time spent trying to figure out what works and what doesn’t drive me mad. With the PSWriteHTML module, a lot has changed. With just a few PowerShell lines, I can create feature-rich reports that change how I show data to my Clients. Today I wanted to show you some advanced HTML reporting without actually complicating PowerShell code. In the last few months, I’ve added many features that create advanced reports without sacrificing readability.
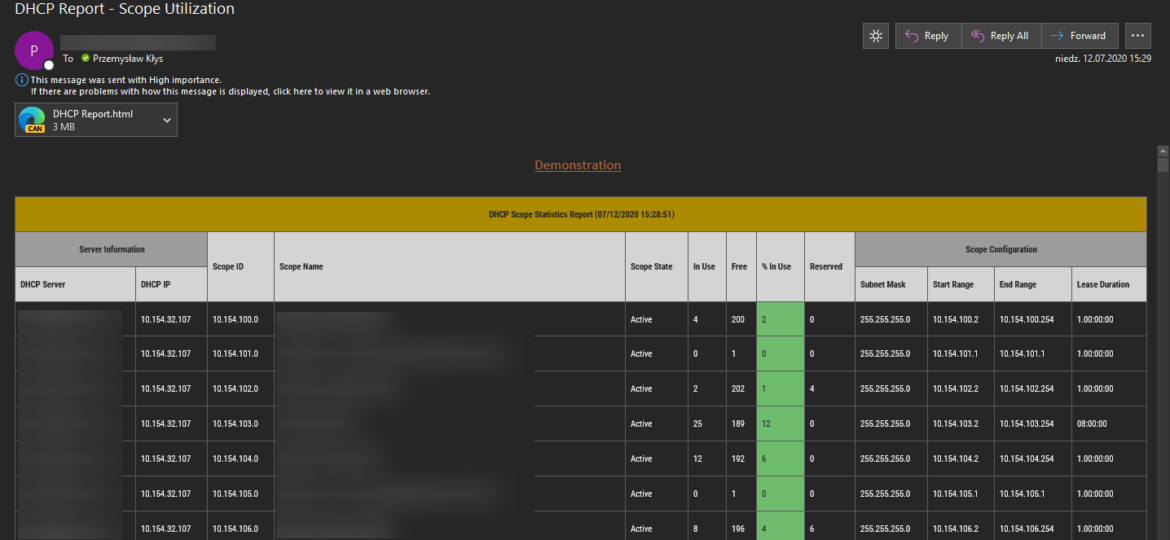
I’m pretty addicted to reading blog posts. I saw this new blog post the other day, where the author created the DHCP HTML report, and he did it by manually building headers, footers, table borders, and finally, adding some coloring to the percentage of DHCP being in use. It’s the “standard” approach to build HTML in PowerShell, and I’ve seen a similar path before, but that got me thinking how much time it would take for me to replicate the very same functionality using PSWriteHTML module.
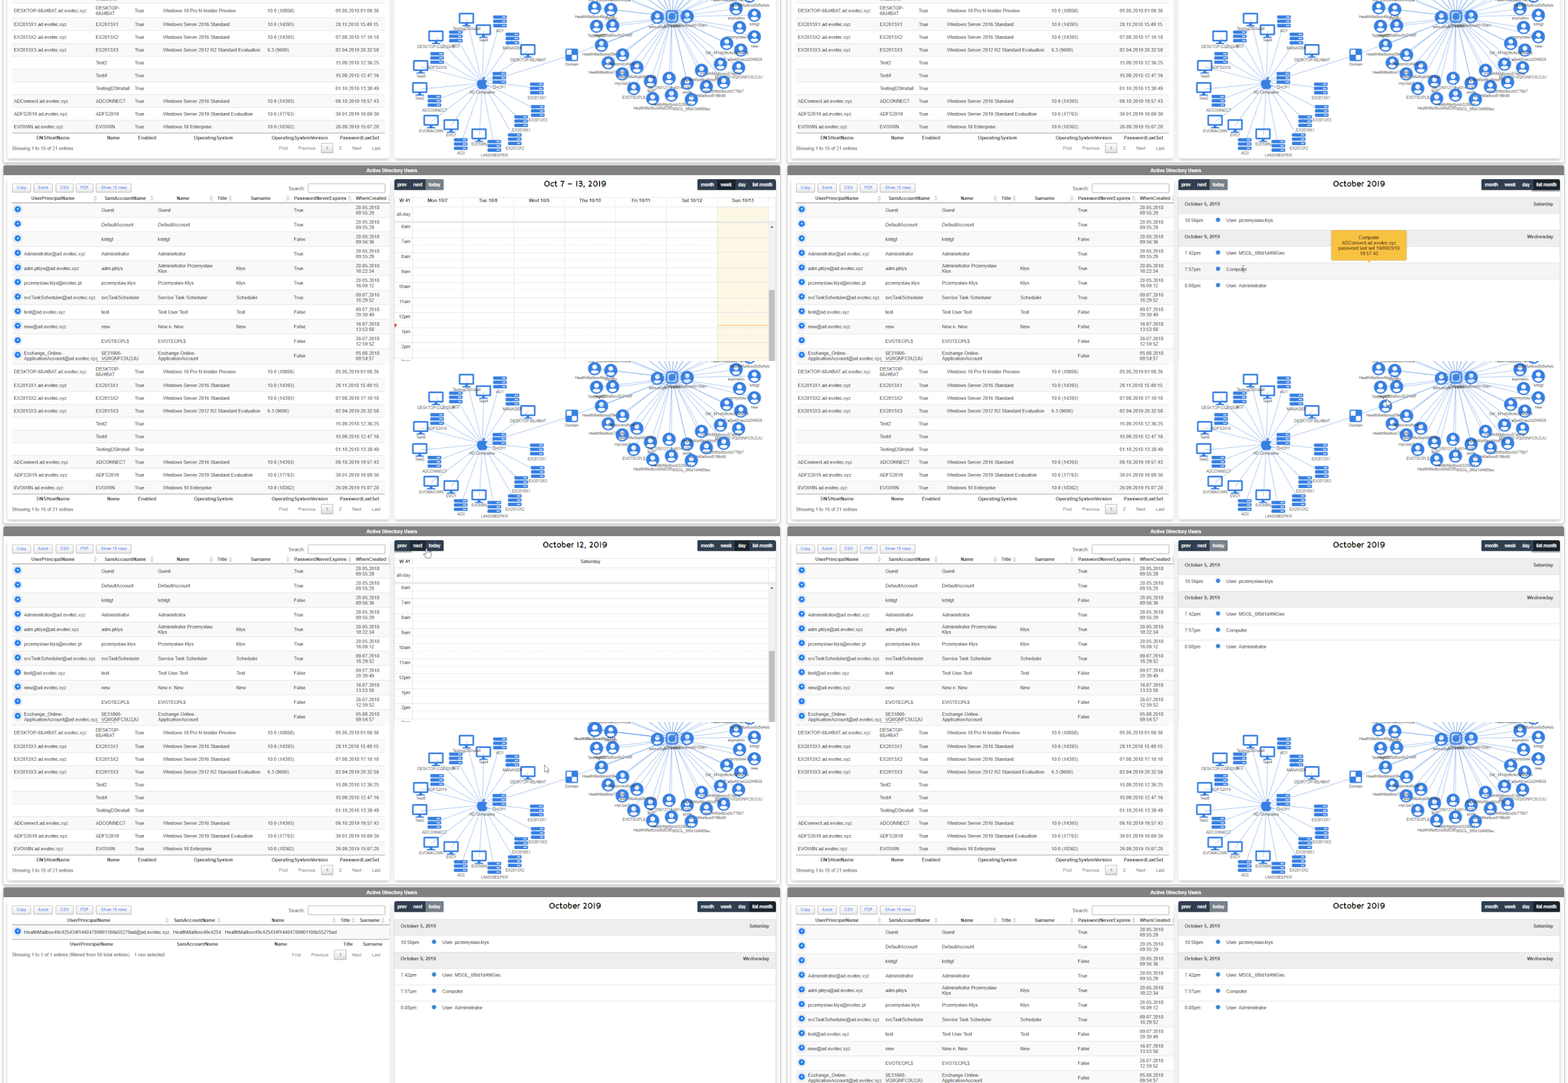
One of the new features I’ve worked on was connecting Diagrams with Tables. Someone suggested, and I thought it would be cool to be able to click on the Diagram node and find more details about it in a table next to it. But then I thought it would be even cooler if you could have multiple tables linked to one Diagram. For example, below, I’ve created two tables with Users and Computers and populated Diagram with that data.
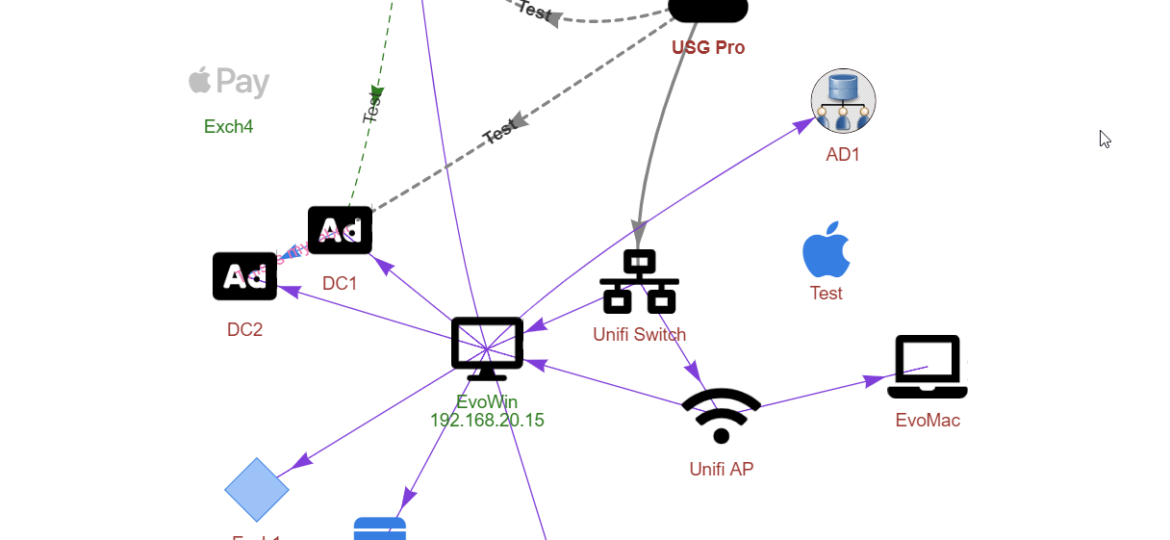
A few months ago, when I was working on PSWriteWord and PSWriteHTML, I thought to myself that in 2020 if I’ll get time, I’ll try to create PSWriteVisio. While I wasn’t sure I would be able to make it past some concept, it was in my plans for 2020. It’s still 2019 though, and while working on Testimo for Active Directory Healthchecks, I thought it would be nice to have a visual representation of network, forest schema or replication. I couldn’t get this idea out of my head. I thought on using PSGraph from Kevin Marquette to generate image and import that to PSWriteHTML but it was a bit tricky and PSGraph requires external software to work – and has some additional steps for Windows, Mac or Linux.

