If you don’t know this yet, I use PSWriteHTML a lot. That means I get to test it under a lot of different conditions. I use it in reports, emails for small, medium, and large companies. Today’s blog post summarizes the work I did in the last few weeks over different areas of PSWriteHTML.
pswritehtml
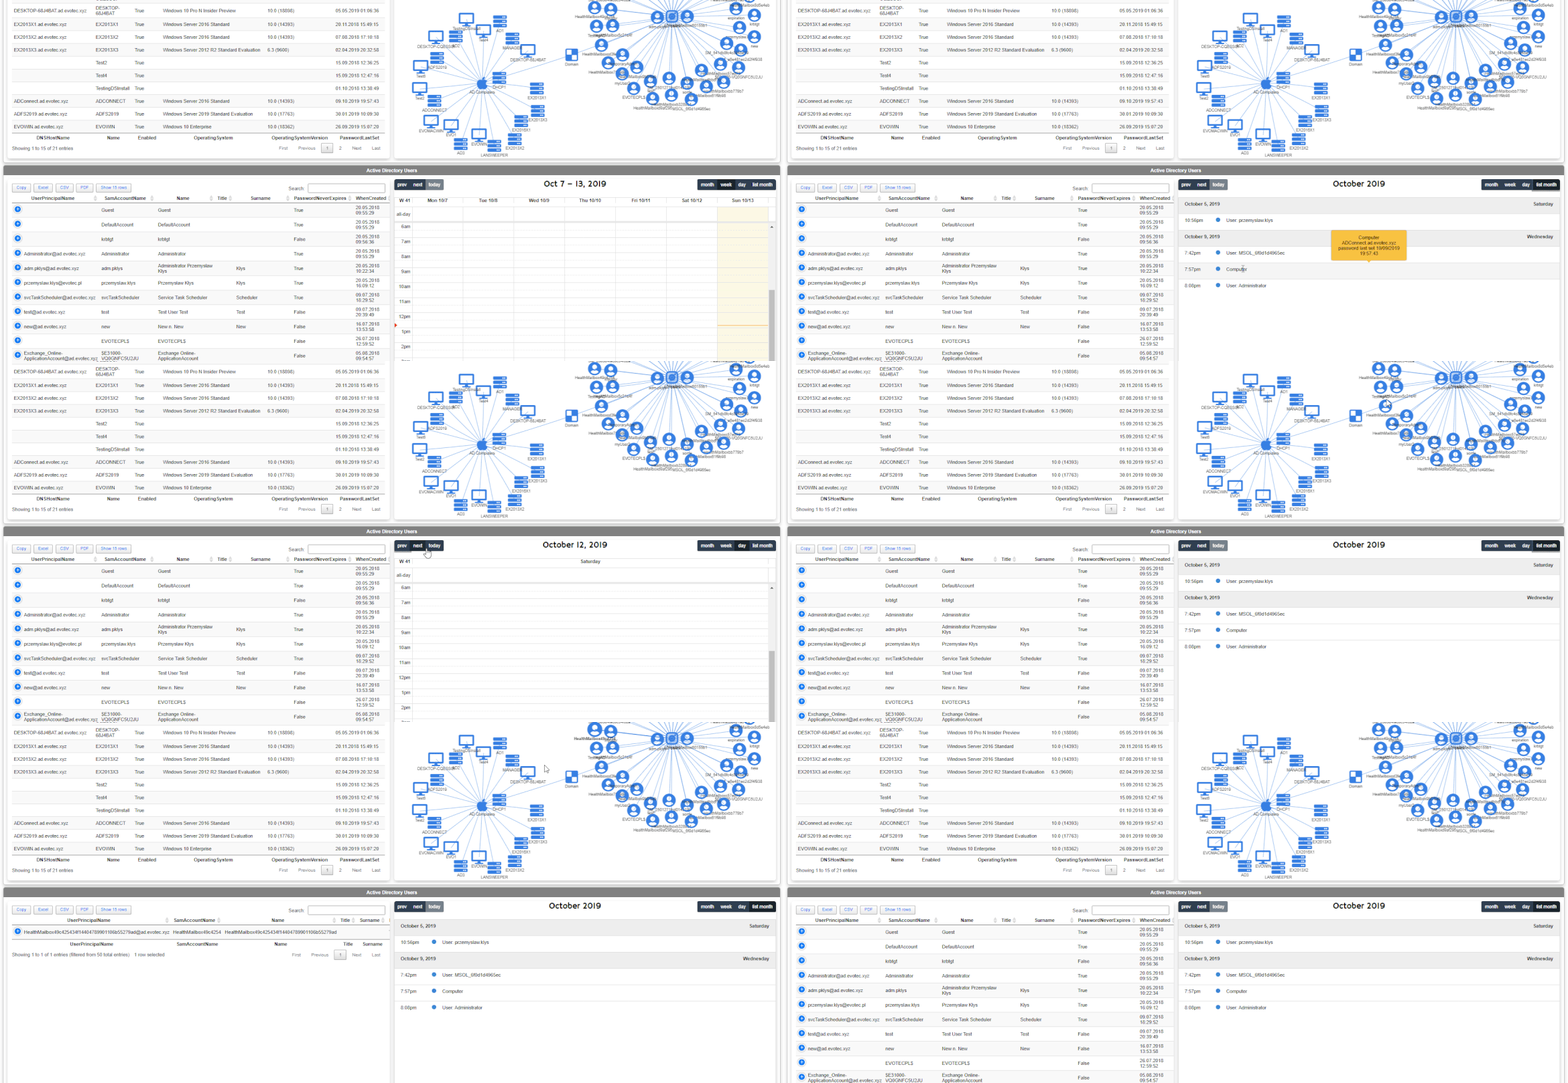
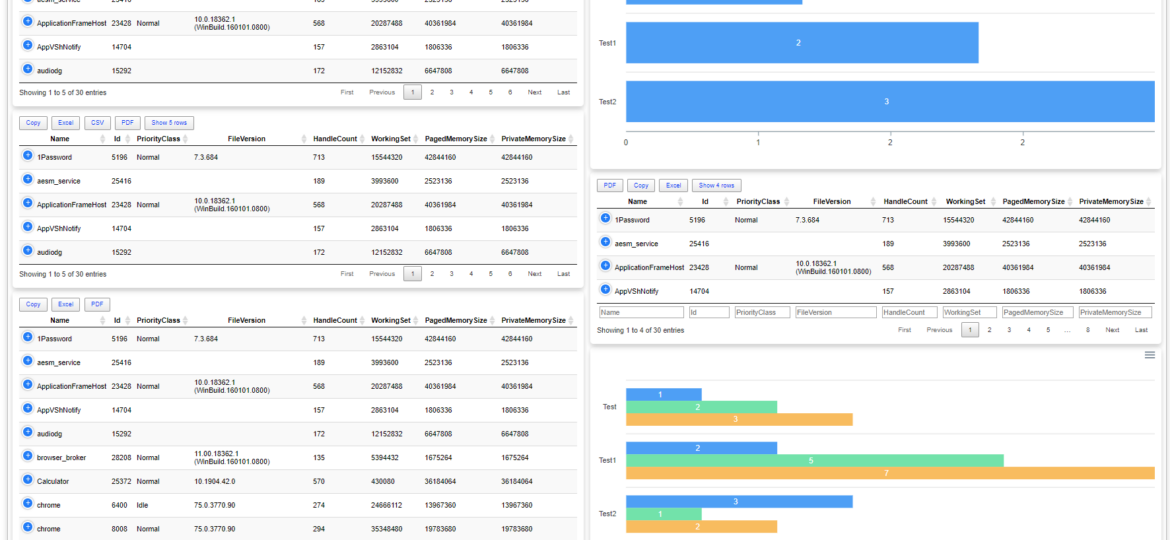
One of the new features I’ve worked on was connecting Diagrams with Tables. Someone suggested, and I thought it would be cool to be able to click on the Diagram node and find more details about it in a table next to it. But then I thought it would be even cooler if you could have multiple tables linked to one Diagram. For example, below, I’ve created two tables with Users and Computers and populated Diagram with that data.
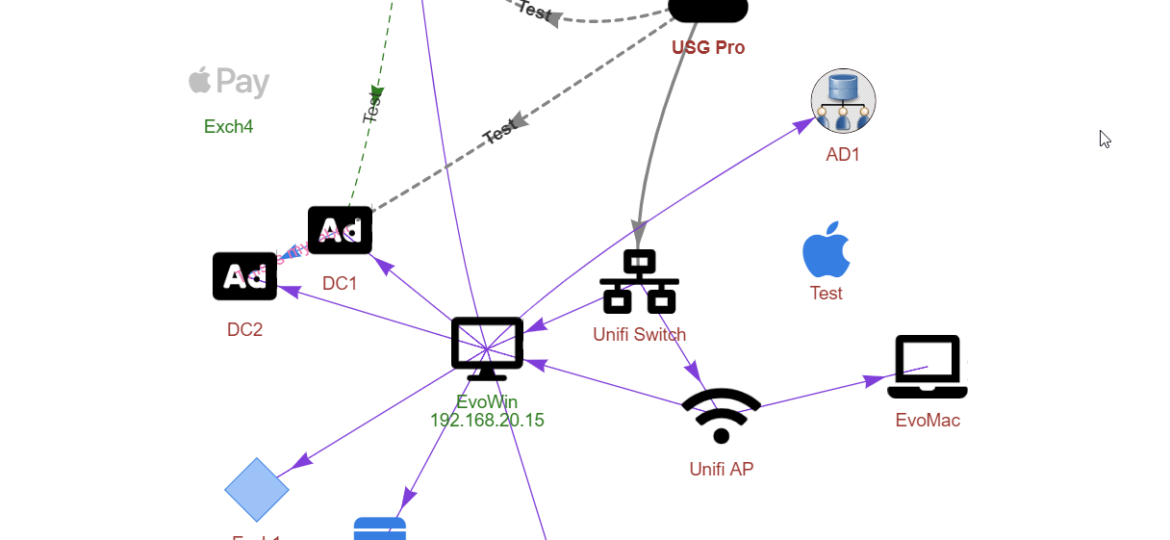
A few months ago, when I was working on PSWriteWord and PSWriteHTML, I thought to myself that in 2020 if I’ll get time, I’ll try to create PSWriteVisio. While I wasn’t sure I would be able to make it past some concept, it was in my plans for 2020. It’s still 2019 though, and while working on Testimo for Active Directory Healthchecks, I thought it would be nice to have a visual representation of network, forest schema or replication. I couldn’t get this idea out of my head. I thought on using PSGraph from Kevin Marquette to generate image and import that to PSWriteHTML but it was a bit tricky and PSGraph requires external software to work – and has some additional steps for Windows, Mac or Linux.
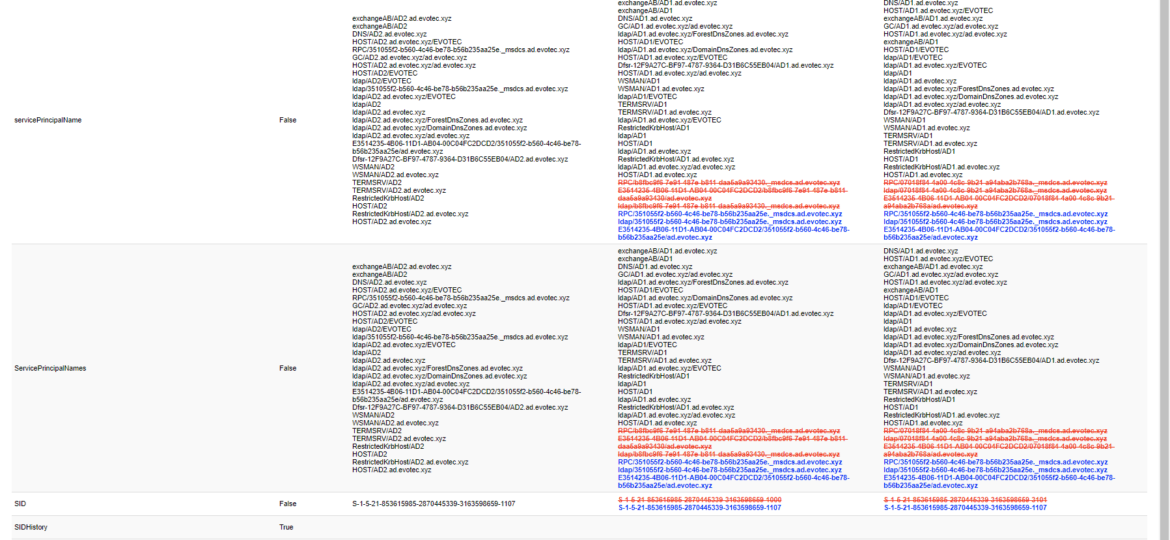
For the last few weeks I’m working on a small project, that should be released within next few weeks (it is open source so don’t worry – you’ll get to play with it). This project requires me to compare two or more objects and tell if those are equal and if those aren’t to what degree. Of course, PowerShell offers built-in functionality via Compare-Object command. It’s mighty but it leaves comparing differences, different properties to you. While there are probably other solutions that help users compare objects, I haven’t found anything that would meet my requirements. After I’ve written Compare-MultipleObjects function, I thought it could be interesting to implement visual comparison – you know human-readable – and I had the perfect place to apply it.
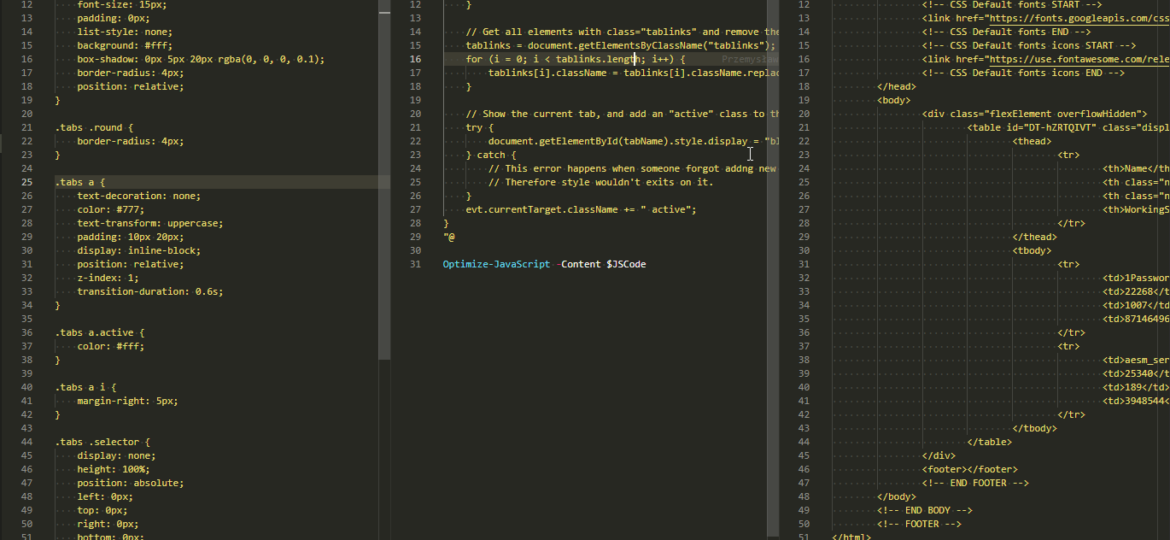
When you work with HTML, CSS, and JavaScript, you often meet three versions on how those are stored in files – minified, formatted, somewhere in the middle (usually a total mess). I have all three versions in my PSWriteHTML module. Some are minified 3rd party resources, some are generated by my PowerShell commands (and are a total mess when it comes to formatting), and finally, some are formatted resources by using built-in VSCode features. In whatever form they are, they generally have no impact on how browsers display them. Browsers will read them in any kind and not care for how they look.
Last few weeks, I’ve been working on making creating HTML based Dashboards, Reports, and Emails better. PSWriteHTML already allows fancy looking reports or emails without much effort, but this release makes it even more helpful. I will be mixing three PowerShell modules in this blost post – PSWriteHTML (responsible for creating HTML/CSS/JS code), Emailimo (simplifies creating emails based on PSWriteHTML) and Dashimo (simple dashboard building). If you’ve never heard of those modules before I encourage you to start from earlier blogs about them to understand the concepts before you dive into this one. Hopefully, those will give you some ideas that will match what you will learn today.
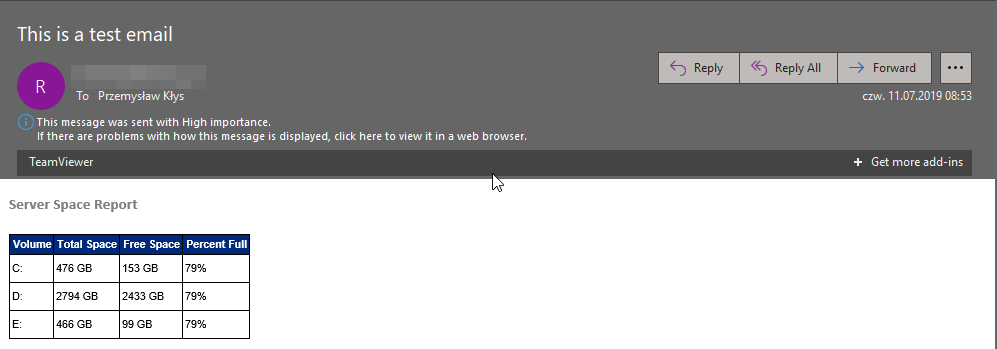
I saw this article by Altaro tweeted Building PowerShell Tools for MSPs: HTML Tables for Reporting, and it describes how you can create HTML emails with just a few lines of code. Luke created that article in 2018 (tweets from the archive I guess), but I just saw it now so thought I would make a slight comparison. In 2018 I would probably go the same way as shown by Luke Orellana, who takes a simple example of querying WMI to get disk drive sizes and send them over, formatted via Email.
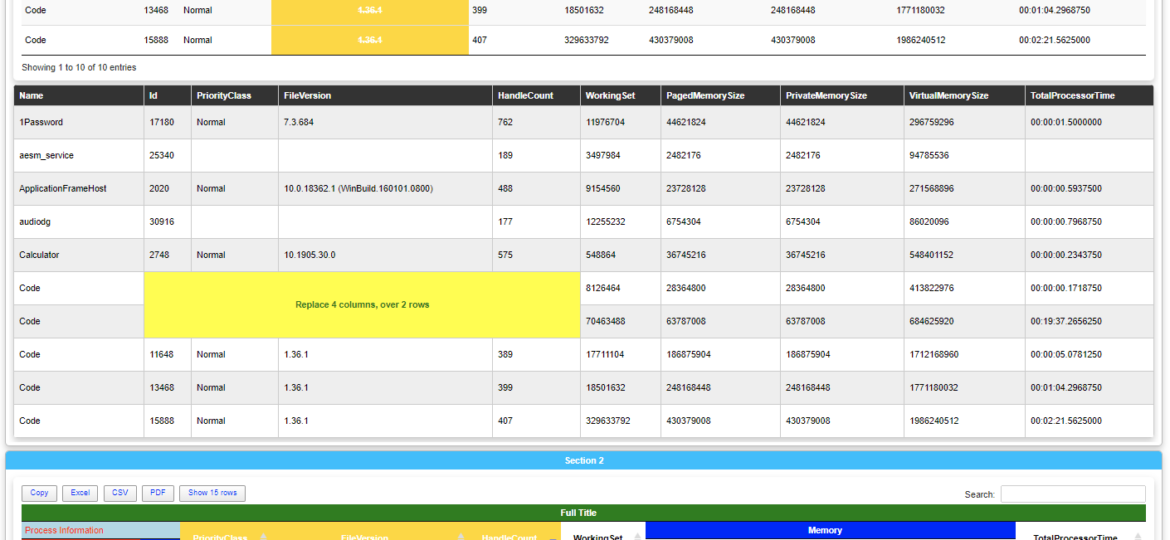
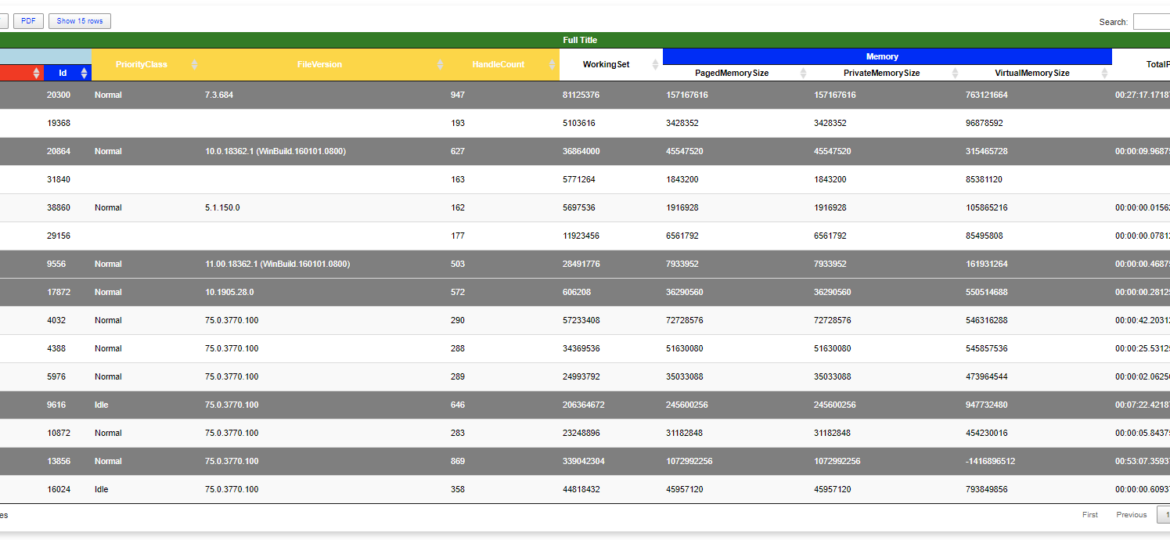
Last few days, I’ve fulfilled my little dream related to building HTML tables. You know I’ve been using HTML based scripts for a long while for Microsoft Exchange from multiple people like Steve Goodman or Paul Cunningham (and others) and when I was going thru their PowerShell building code on how they create an HTML table with multi-row titles I thought Those guys are crazy. The effort to build an HTML table for a report for a person who has no clue how to do it is not something one can easily digest and understand. Sure I’ve learned how to build HTML tables at some point, but there was one final piece that I was missing – multi-row headers. If you don’t know what I mean, and how they look like the below image from Steve’s Goodman script should give you a hint.
A few months ago when I first released Dashimo, I’ve promised that Charts will come. Unfortunately, time passed by, and there were no Charts in sight. It’s not that I didn’t want to deliver, I just wasn’t sure on the way I want to allow charts building. Today after playing with the idea for a while I’ve decided to release essential support for diagrams, with a couple of other fixes. Some of that stuff is already there for longer while I just never announced it. There are probably a lot of other hidden gems you may find if you explore PSWriteHTML or Dashimo.
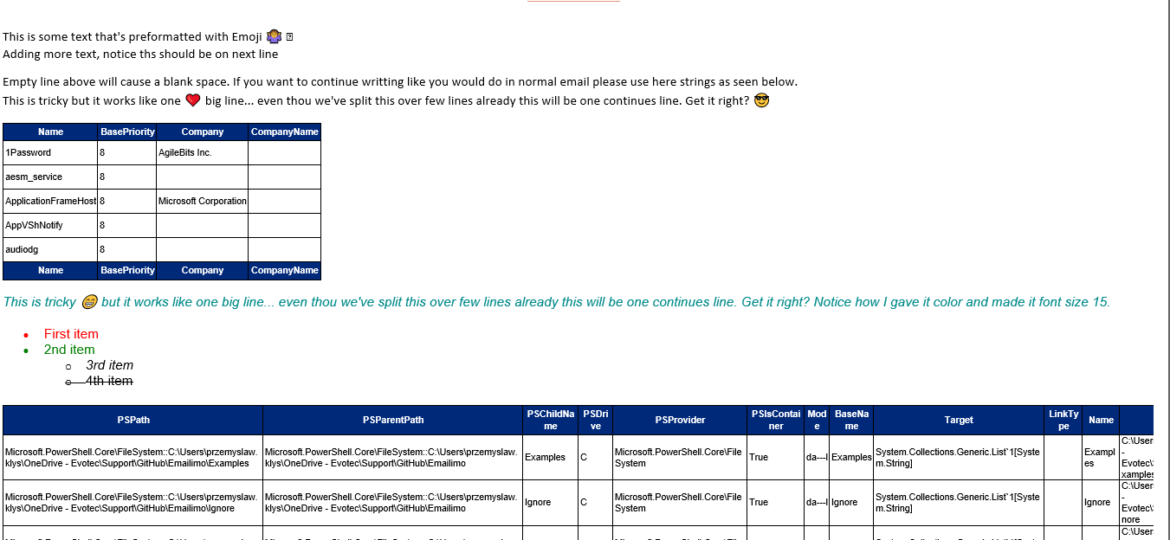
When reading this blog post, you may be thinking that there’s nothing new one can add to emailing with PowerShell as there were tons of articles in recent years covering this subject pretty good. It’s all known, and people have used it since the early days of PowerShell. You can even send an email with just one line using Send-MailMessage. Now, this post is not about that. This post is about sending HTML based emails. You see when you want to send an email that is just text based that’s pretty trivial. Things get complicated when you want your emails to have some colors, some tables, some links or some lists. This is where you have to involve HTML and CSS. Since I’ve been working with PowerShell for a while now, I’ve seen my share of scripts/modules or blog posts that cover this but one thing that usually hit me – it was sometimes tough to understand what is happening, what the author is doing, and what happens if I change this or that. While I’ve seen people dismissing programmers doing HTML / CSS or JavaScript for not being real programmers, I disagree entirely. You have to know what you’re doing if you want your stuff to look good. I’ve spent days or even weeks playing with HTML/CSS/JS, and I must admit half of what I do I don’t even understand until I see the output. So before you go and tell people that HTML/CSS is easy, think again.

