A few months ago when I first released Dashimo, I've promised that Charts will come. Unfortunately, time passed by, and there were no Charts in sight. It's not that I didn't want to deliver, I just wasn't sure on the way I want to allow charts building. Today after playing with the idea for a while I've decided to release essential support for diagrams, with a couple of other fixes. Some of that stuff is already there for longer while I just never announced it. There are probably a lot of other hidden gems you may find if you explore PSWriteHTML or Dashimo. Before I go into details of this release I wanted to say Big Thank You to people that take time to submit issues and even bigger thanks to those doing Pull Requests. It really means a lot. You can now thank Ferdi Weiner who added the ability to Sort by DateTime in Table.
💡 Dashimo – What is it?
If you don't know what Dashimo is, I encourage you to take a moment and read both articles below. It will make sense, and I won't have to repeat myself trying to explain basics. It's effortless and intuitive but still worth a read.
What you should also know is that Dashimo uses a bit different naming convention then your standard PowerShell Modules do. If you don't like that convention feel free to use PSWriteHTML. PSWriteHTML is what powers Dashimo and few other modules such as Statusimo, Emailimo or Out-HTMLView and is responsible for providing me friendly interface for building HTML/CSS and JavaScript. If you want to dig down into sources and find out what powers Dashimo, you need to do that in PSWriteHTML repository. Any changes, any fixes go there as well. Dashimo is just a concept and something I can type when woken up in the middle of the night.
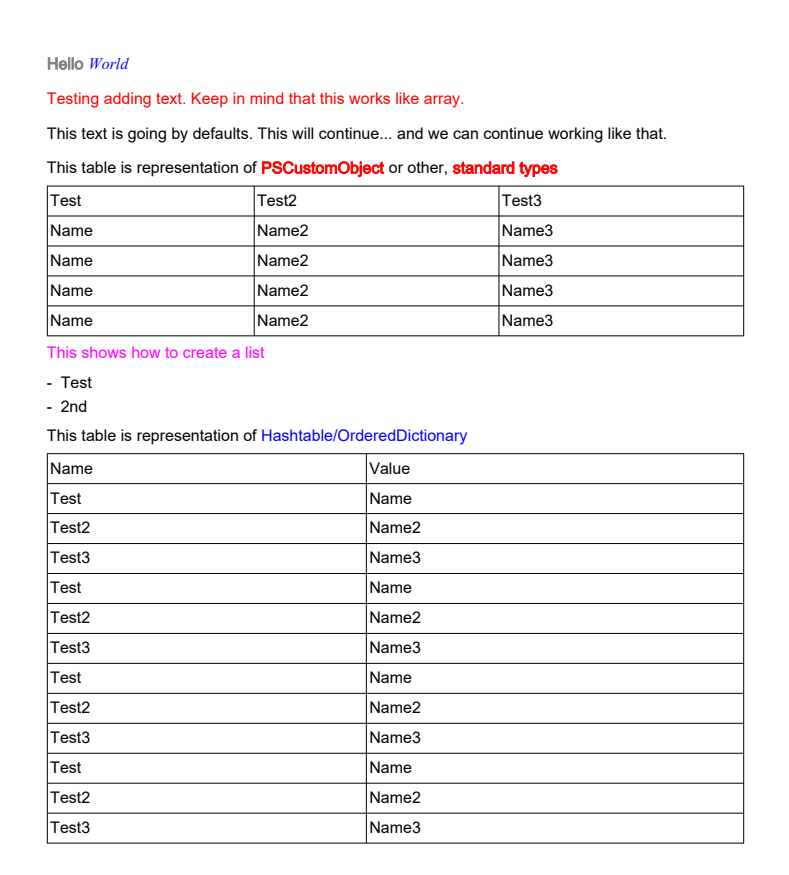
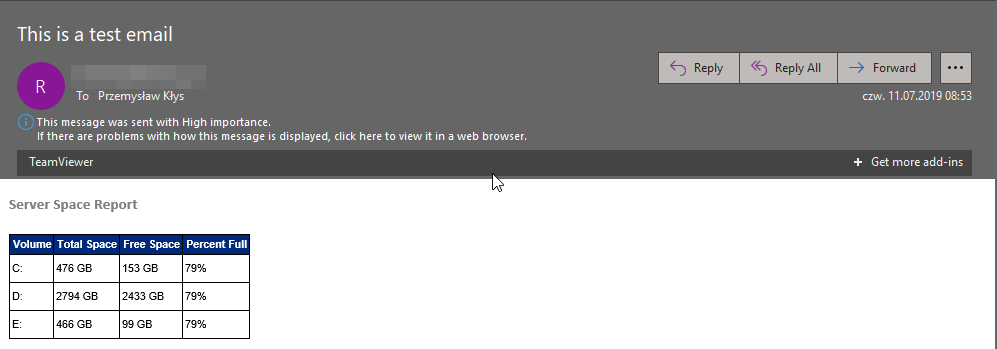
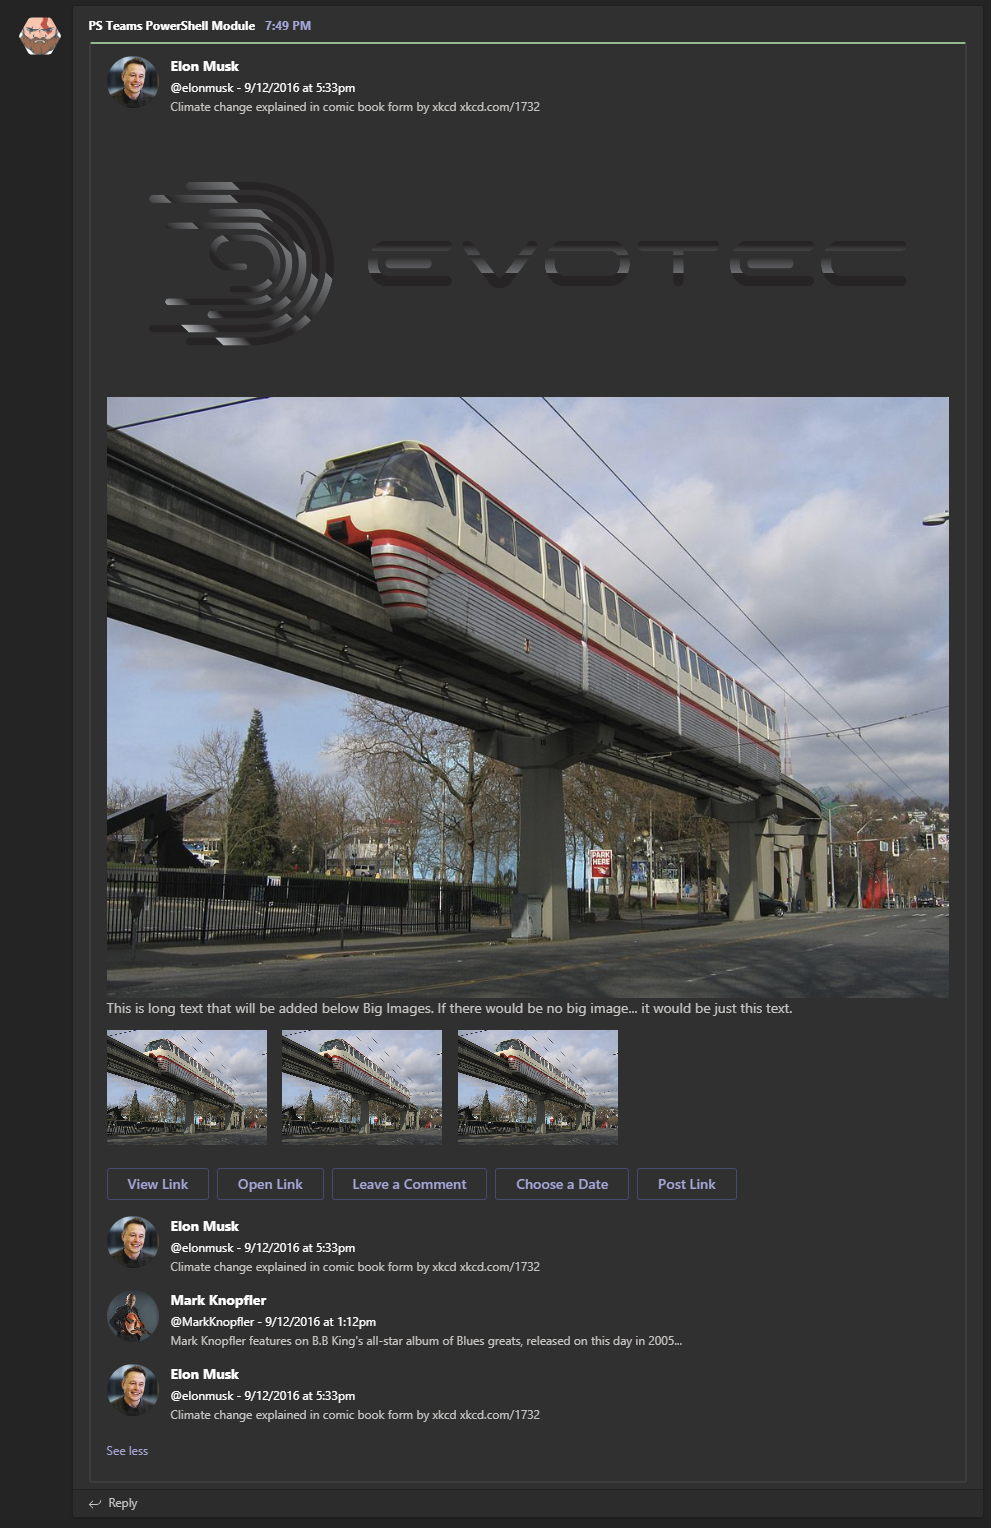
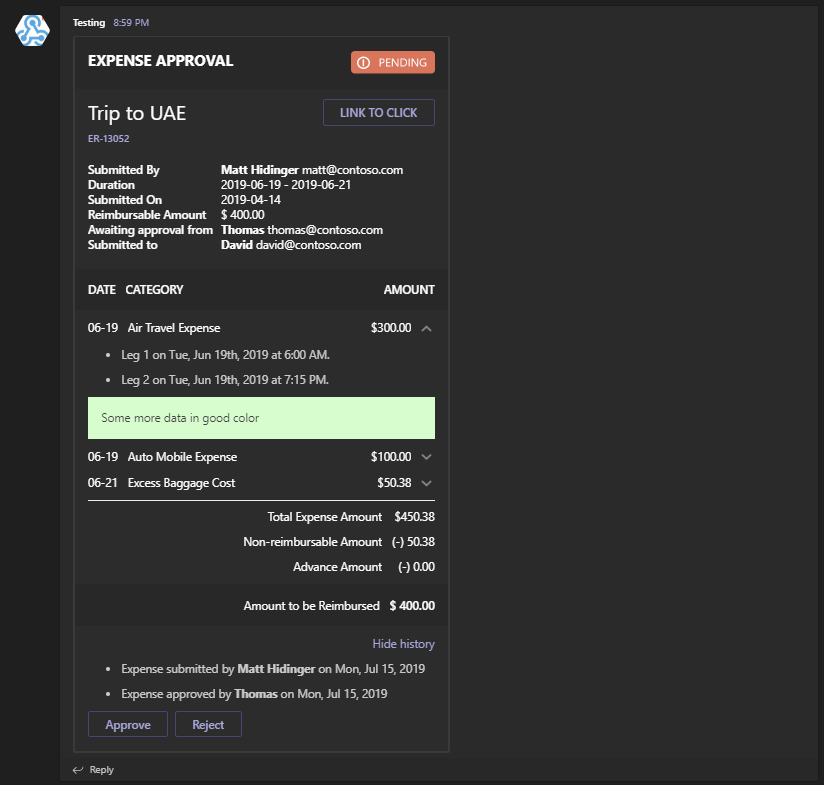
What is very important about Dashimo or PSWriteHTML is that it produces a single HTML file. A portable file can be sent via email, opened up from disk or hosted on a website. This makes it easy to use, flexible with lots of features. Best of it – you don't have to know HTML at all to produce it. Below you can find four examples hosted on my website. There's nothing fancy about it. Just uploaded HTML file and it works. It will behave the same on IIS or when run from disk.
💡 Give me charts!
Let's start with a very simple Bar Chart example.
Dashboard -Name 'Charts - Bar' -FilePath $PSScriptRoot\Output\DashboardChartsBar00.html {
    Chart {
        ChartLegend -Name 'Time'
        ChartBar -Name 'Test' -Value 1
        ChartBar -Name 'Test1' -Value 2
        ChartBar -Name 'Test2' -Value 3
    }
} -Show
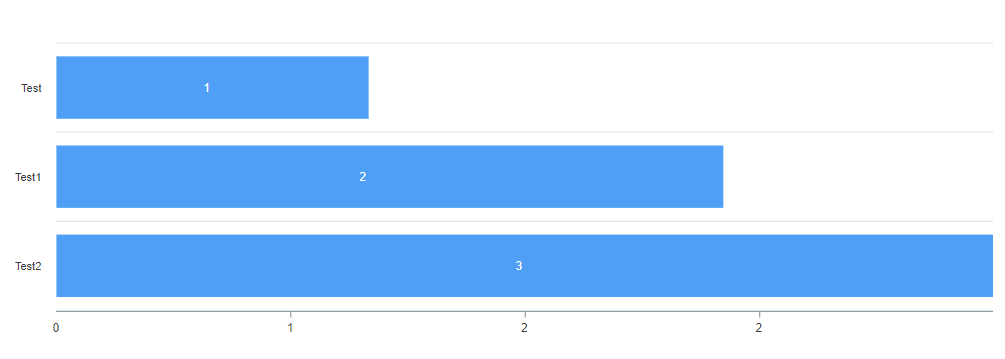
As you see what we did above we simply opened up Chart, added legend, and three bars. That's what we see on the screen. If you're wondering where is legend… well here it is, showing up when we hover over bars.
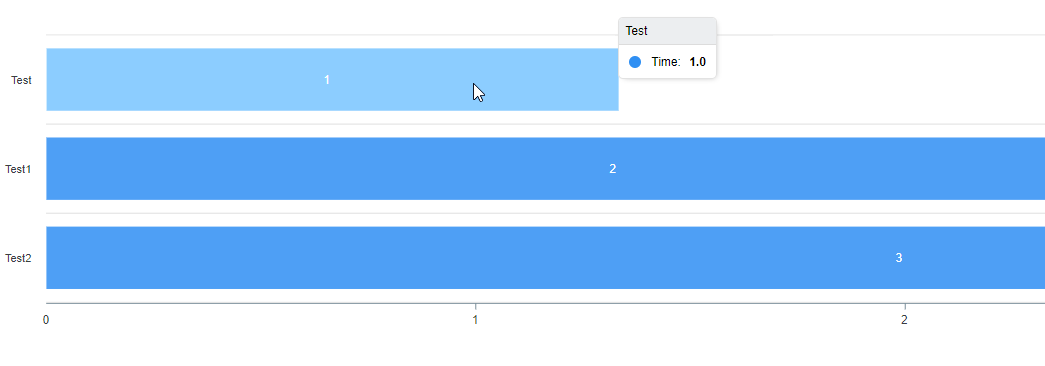
This is a very simple scenario, and not really something you will be doing with Dashimo. Let's try a bit different example with 4 charts one after another.
Import-Module Dashimo -Force

Dashboard -Name 'Charts - Bar' -FilePath $PSScriptRoot\Output\DashboardChartsBar00.html {
    Panel {
        Chart {
            ChartLegend -Name 'Time'
            ChartBar -Name 'Test' -Value 1
            ChartBar -Name 'Test1' -Value 2
            ChartBar -Name 'Test2' -Value 3
        }
    }
    Panel {
        Chart {
            ChartToolbar -Download
            ChartLegend -Name 'Time', 'Money', 'Taxes'
            ChartBar -Name 'Test' -Value 1, 2, 3
            ChartBar -Name 'Test1' -Value 2, 5, 7
            ChartBar -Name 'Test2' -Value 3, 1, 2
        }
    }
    Panel {
        Chart {
            ChartLegend -Name 'Time'
            for ($i = 0; $i -le 5; $i++) {
                ChartBar -Name "Test $i" -Value $i
            }
        }
    }
    Panel {
        Chart {
            ChartBarOptions -Vertical -DataLabelsColor GreenYellow
            ChartLegend -Name 'Time'
            for ($i = 0; $i -le 5; $i++) {
                ChartBar -Name "Test $i" -Value $i
            }
        }
    }
} -Show
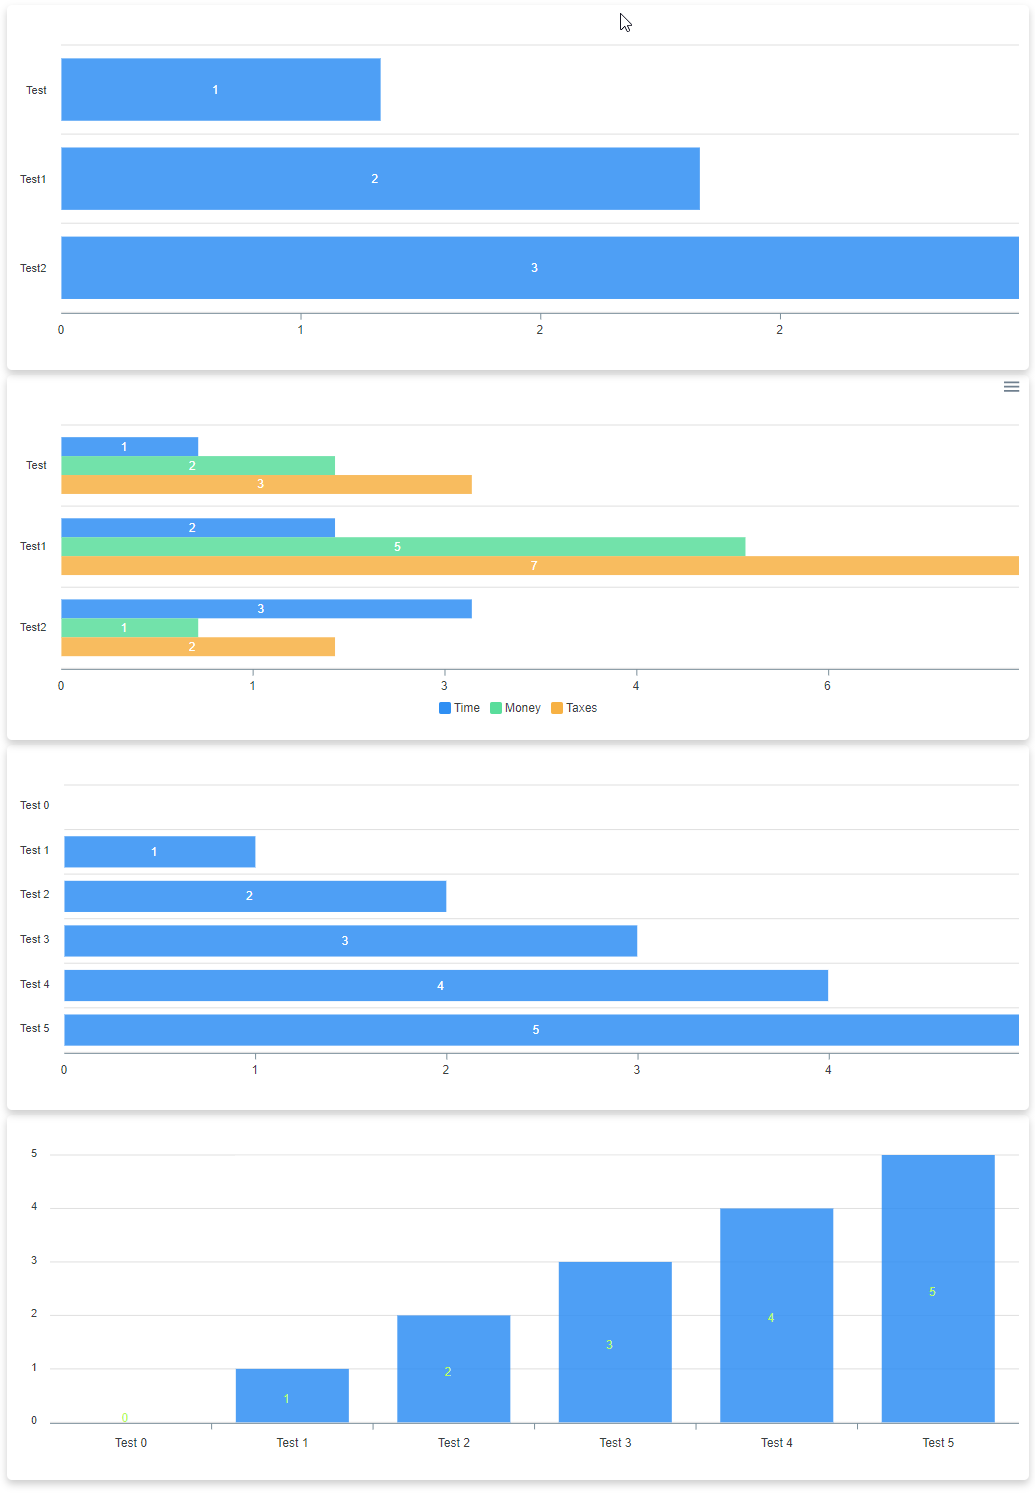
But the power of Dashimo is only visible when you play with Sections. In the next example, I've taken code from above and simply wrapped all four charts into one section. What more I made that section invisible. What do we get?
Import-Module Dashimo -Force

Dashboard -Name 'Charts - Bar' -FilePath $PSScriptRoot\DashboardChartsBar00.html {
    Section -Invisible {
        Panel {
            Chart {
                ChartLegend -Name 'Time'
                ChartBar -Name 'Test' -Value 1
                ChartBar -Name 'Test1' -Value 2
                ChartBar -Name 'Test2' -Value 3
            }
        }
        Panel {
            Chart {
                ChartToolbar -Download
                ChartLegend -Name 'Time', 'Money', 'Taxes'
                ChartBar -Name 'Test' -Value 1, 2, 3
                ChartBar -Name 'Test1' -Value 2, 5, 7
                ChartBar -Name 'Test2' -Value 3, 1, 2
            }
        }
        Panel {
            Chart {
                ChartLegend -Name 'Time'
                for ($i = 0; $i -le 5; $i++) {
                    ChartBar -Name "Test $i" -Value $i
                }
            }
        }
        Panel {
            Chart {
                ChartBarOptions -Vertical -DataLabelsColor GreenYellow
                ChartLegend -Name 'Time'
                for ($i = 0; $i -le 5; $i++) {
                    ChartBar -Name "Test $i" -Value $i
                }
            }
        }
    }
} -Show
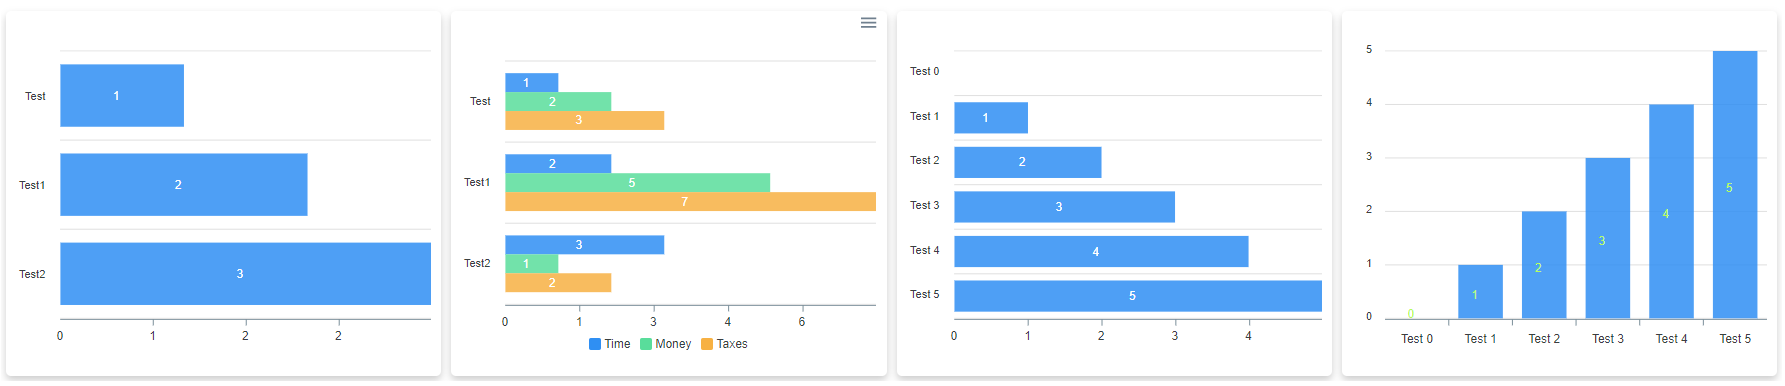
We get four charts next to each other. Nice right? They are fully responsive, so when you scale, they will be larger or smaller. You should also notice there is ChartToolbar command. This command allows you to enable more features to Charts, such as the ability to download them as SVG or PNG. The best thing about this is that there is no single HTML or CSS or JS knowledge required to build that.
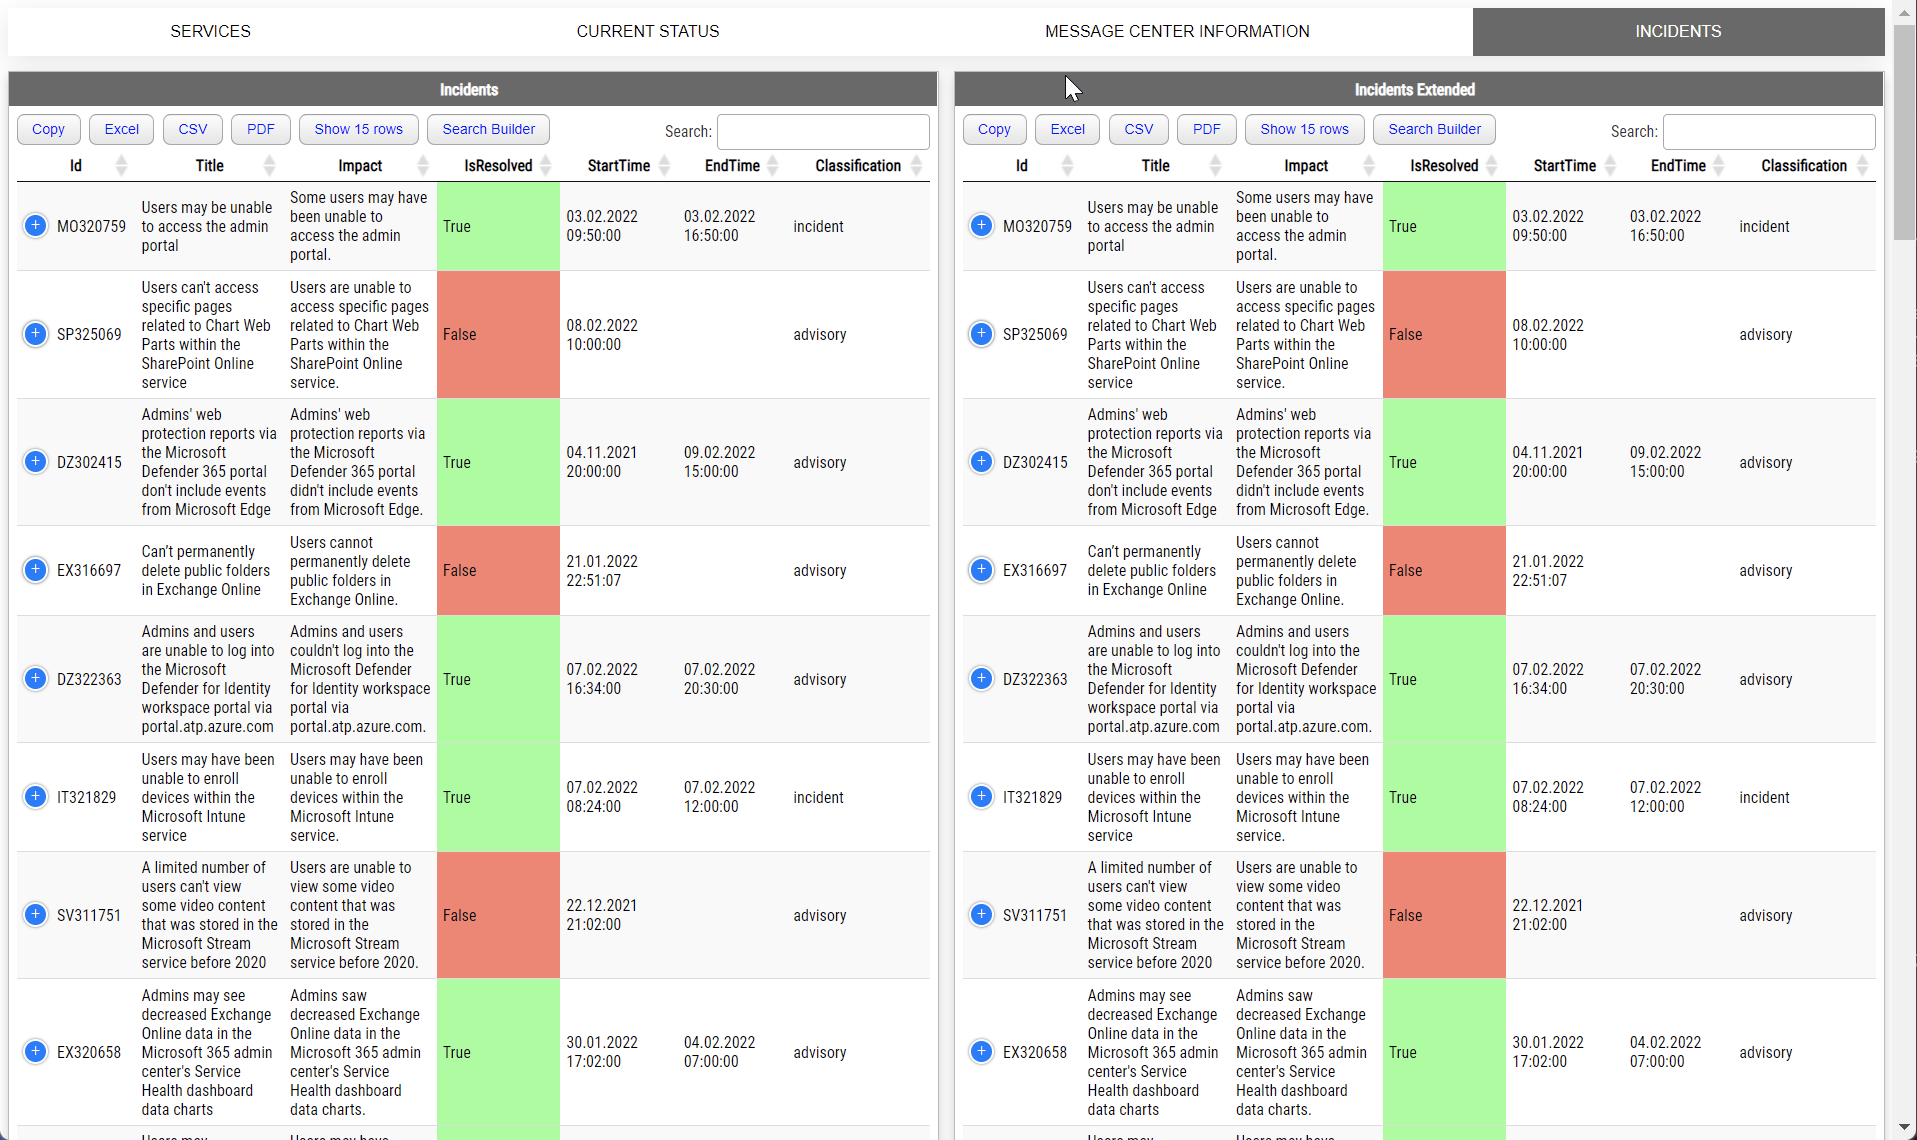
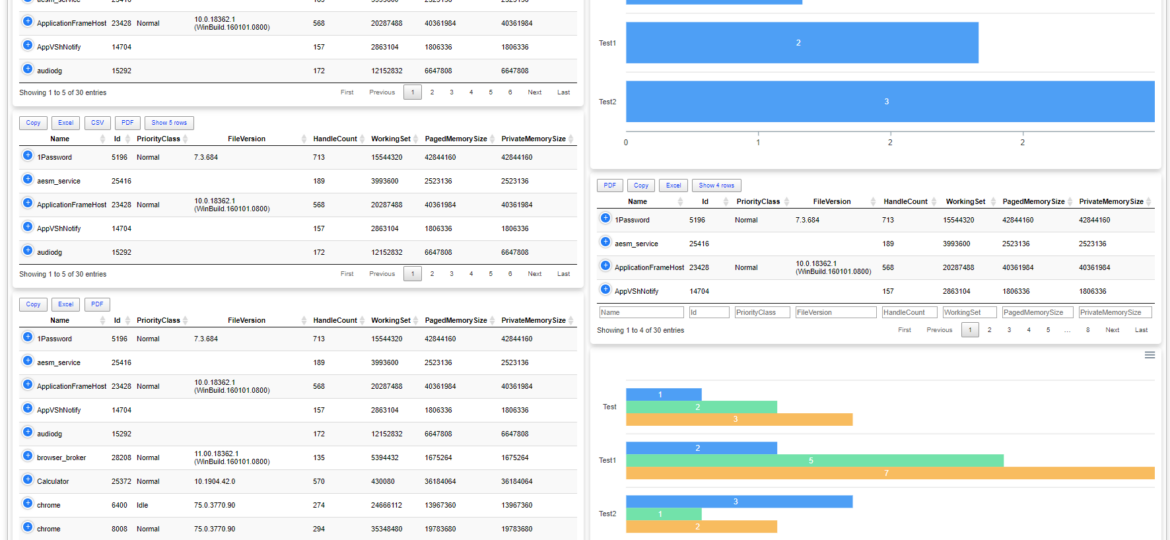
💡 Mixing charts and tables
Let's not forget about all the other features we already had. Dashimo is famous (at least 5 people are using it! – that has to count right?) for its the ability to play with nice with Tables. Below code simply takes charts and expands it with some table along with with table conditional formatting.
Import-Module Dashimo -Force

$Process = Get-Process | Select-Object -First 30

Dashboard -Name 'Charts - Bar' -FilePath $PSScriptRoot\Output\DashboardChartsBar00.html {
    Section -Invisible {
        Panel {
            Chart {
                ChartLegend -Name 'Time'
                ChartBar -Name 'Test' -Value 1
                ChartBar -Name 'Test1' -Value 2
                ChartBar -Name 'Test2' -Value 3
            }
        }
        Panel {
            Chart {
                ChartToolbar -Download
                ChartLegend -Name 'Time', 'Money', 'Taxes'
                ChartBar -Name 'Test' -Value 1, 2, 3
                ChartBar -Name 'Test1' -Value 2, 5, 7
                ChartBar -Name 'Test2' -Value 3, 1, 2
            }
        }
        Panel {
            Chart {
                ChartLegend -Name 'Time'
                for ($i = 0; $i -le 5; $i++) {
                    ChartBar -Name "Test $i" -Value $i
                }
            }
        }
        Panel {
            Chart {
                ChartBarOptions -Vertical -DataLabelsColor GreenYellow
                ChartLegend -Name 'Time'
                for ($i = 0; $i -le 5; $i++) {
                    ChartBar -Name "Test $i" -Value $i
                }
            }
        }
    }
    Section -Invisible {
        Table -DataTable $Process -HideFooter {
            TableConditionalFormatting -Name 'ID' -ComparisonType number -Operator gt -Value 10000 -Color BlueViolet -Row
            TableConditionalFormatting -Name 'Name' -ComparisonType string -Operator eq -Value 'chrome' -Color White -BackgroundColor Crimson -Row
            TableConditionalFormatting -Name 'PriorityClass' -ComparisonType string -Operator eq -Value 'Idle' -Color White -BackgroundColor Green
        }
    }
} -Show
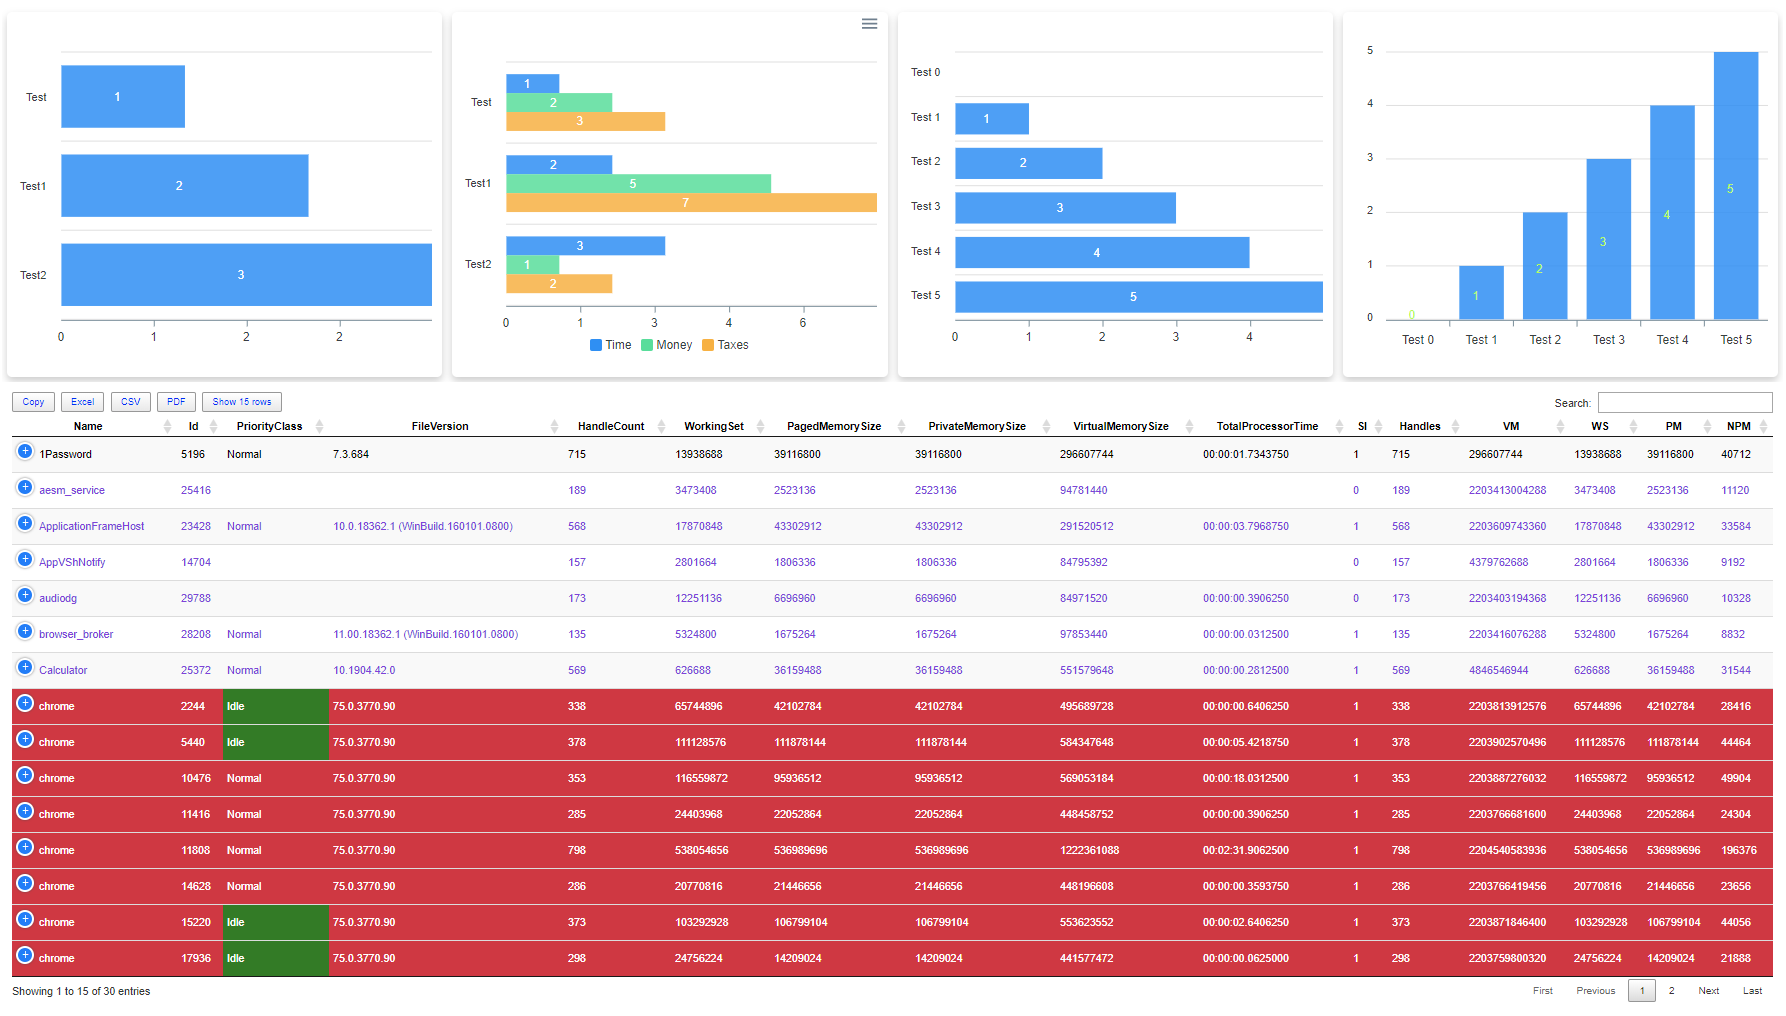
What's important here is that Conditional Table Formatting works on JS level. It means PowerShell doesn't take time to generate it. It happens when you open Chrome or Firefox and is processed during runtime. Of course, Panel's can also take Invisible parameter, so you don't need to see those shadows if you don't want to. So not only now you can display Table, download it to Excel, CSV, PDF, but also connect with charts. Cool right?
💡 Additional table options with some chart settings
Now, let's take one more step, shall we? We're going to add line charts, make panels invisible, add table next to charts and also change PDF output settings. That's not all, I've also changed paging options so that only seven elements are visible in the table in the right down corner. And the full code above generated in more or less 3 seconds.
Import-Module Dashimo -Force

$Process = Get-Process | Select-Object -First 30

Dashboard -Name 'Charts - Bar' -FilePath $PSScriptRoot\Output\DashboardChartsBar00.html {
    Section -Invisible {
        Panel -Invisible {
            Chart {
                ChartLegend -Name 'Time'
                ChartBar -Name 'Test' -Value 1
                ChartBar -Name 'Test1' -Value 2
                ChartBar -Name 'Test2' -Value 3
            }
        }
        Panel -Invisible {
            Chart {
                ChartToolbar -Download
                ChartLegend -Name 'Time', 'Money', 'Taxes'
                ChartBar -Name 'Test' -Value 1, 2, 3
                ChartBar -Name 'Test1' -Value 2, 5, 7
                ChartBar -Name 'Test2' -Value 3, 1, 2
            }
        }
        Panel -Invisible {
            Chart {
                ChartLegend -Name 'Time'
                for ($i = 0; $i -le 5; $i++) {
                    ChartBar -Name "Test $i" -Value $i
                }
            }
        }
        Panel -Invisible {
            Chart {
                ChartBarOptions -Vertical -DataLabelsColor GreenYellow
                ChartLegend -Name 'Time'
                for ($i = 0; $i -le 5; $i++) {
                    ChartBar -Name "Test $i" -Value $i
                }
            }
        }
    }
    Section -Invisible {
        Table -DataTable $Process -HideFooter {
            TableConditionalFormatting -Name 'ID' -ComparisonType number -Operator gt -Value 10000 -Color BlueViolet -Row
            TableConditionalFormatting -Name 'Name' -ComparisonType string -Operator eq -Value 'chrome' -Color White -BackgroundColor Crimson -Row
            TableConditionalFormatting -Name 'PriorityClass' -ComparisonType string -Operator eq -Value 'Idle' -Color White -BackgroundColor Green
        }
    }
    Section -Invisible {
        Panel -Invisible {
            Chart -Title 'Incidents Reported vs Solved' -TitleAlignment center {
                ChartAxisX -Name 'Jan', 'Feb', 'Mar', 'Apr', 'May', 'Jun', 'Jul', 'Aug', 'Sep'
                ChartLine -Name 'Incidents per month' -Value 10, 41, 35, 51, 49, 62, 69, 91, 148
                ChartLine -Name 'Incidents per month resolved' -Value 5, 10, 20, 31, 49, 62, 69, 91, 148
            }
        }
        Panel -Invisible {
            Chart -Title 'Incidents Reported vs Solved' -TitleAlignment center {
                ChartAxisX -Name 'Jan', 'Feb', 'Mar', 'Apr', 'May', 'Jun', 'Jul', 'Aug', 'Sep'
                ChartLine -Name 'Incidents per month' -Value 10, 41, 35, 51, 49, 62, 69, 91, 148 -Color Red -Cap square -Dash 5
                ChartLine -Name 'Incidents per month resolved' -Value 5, 10, 20, 31, 49, 62, 69, 91, 148 -Color Green -Curve stepline -Width 10
            }
        }
        Panel -Invisible {
            Table -DataTable $Process -Filtering -FilteringLocation Bottom -PagingOptions 7, 14 {
                TableButtonExcel
                TableButtonPDF -Title 'Test' -PageSize A4 -Orientation landscape
                TableButtonPageLength
                TableConditionalFormatting -Name 'ID' -ComparisonType number -Operator gt -Value 10000 -Color BlueViolet -Row
                TableConditionalFormatting -Name 'Name' -ComparisonType string -Operator eq -Value 'chrome' -Color White -BackgroundColor Crimson -Row
                TableConditionalFormatting -Name 'PriorityClass' -ComparisonType string -Operator eq -Value 'Idle' -Color White -BackgroundColor Green
            }
        }
    }
} -Show
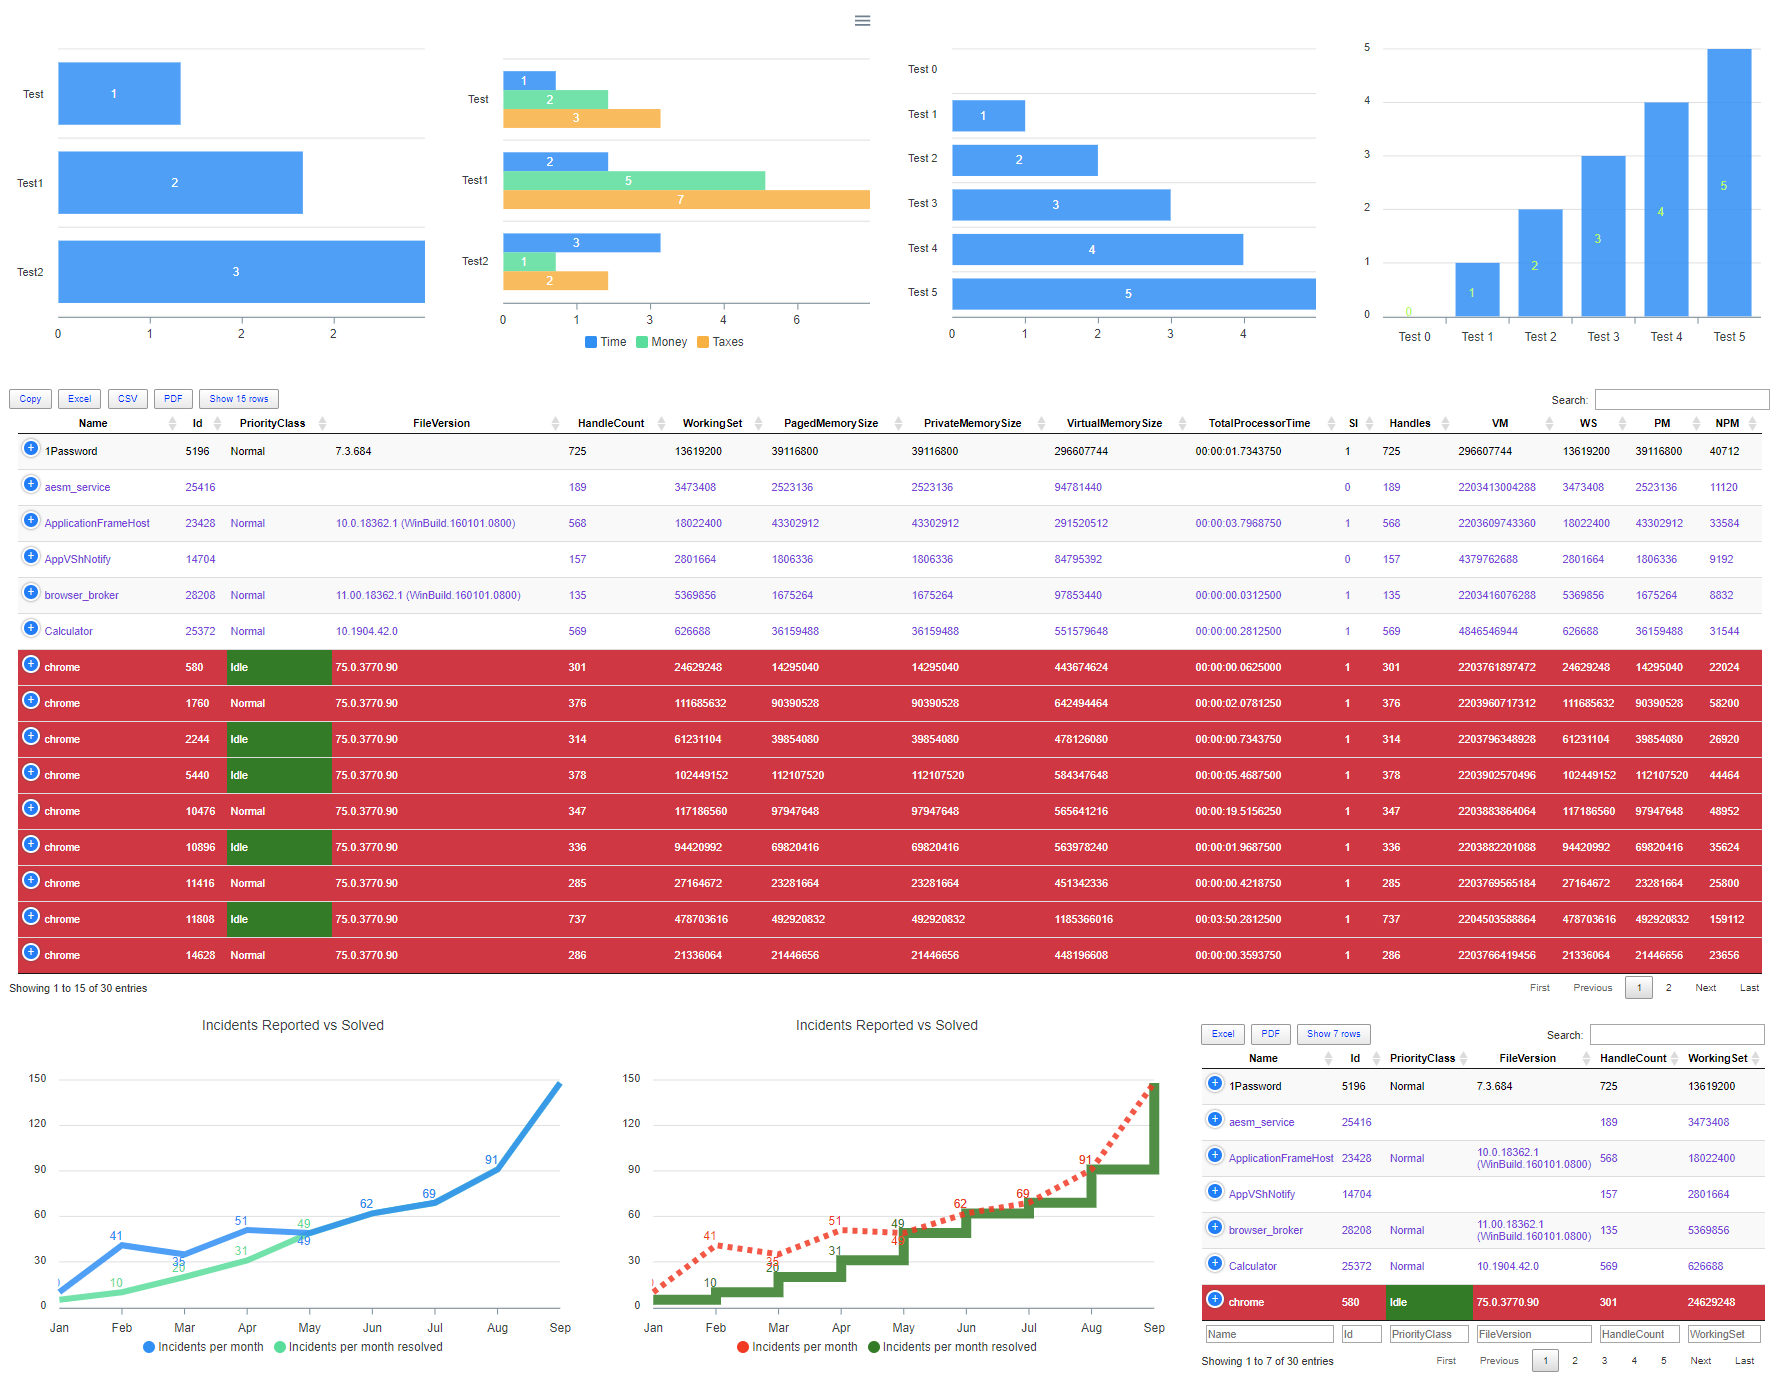
Keep in mind that I'm only showing here just a handful of options and not a full scope of it. All commands have lots of different parameters allowing you to customize charts, tables as you want – adding colors, changing how they look, and so on. Have you noticed filtering and search in a table?
💡 Additional table options with some chart settings
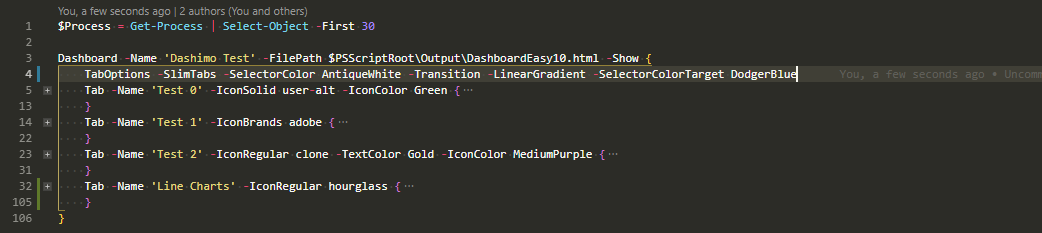
While working on the new version I've fixed a handful of bugs, but also added a couple of more features expanding current functionality. Some of you asked if they change tab colors, or change tab icon. You see when I originally planned tabs I wanted to support multiple icons and lots of options, but since I tend to get distracted a lot with fancy new projects adding some things take time. That basically meant you would be stuck with Bomb icon in Tabs. It's not a big deal, but it wasn't really nice. Each tab having the same icon. Who would want that? Well, not me. So what I did? I've changed a few things and now you can control Tabs and choose one of 1400 icons.
As you see above you're now able to make Tabs slim, add icons, change the color of icon and color of text separately, and well a couple of other things.
$Process = Get-Process | Select-Object -First 30
Dashboard -Name 'Dashimo Test' -FilePath $PSScriptRoot\Output\DashboardEasy10.html -Show {
TabOptions -SlimTabs
Tab -Name 'Test 0' -IconSolid user-alt -IconColor Green {
Table -DataTable $Process -HideFooter {
TableButtonExcel
TableButtonPageLength
TableConditionalFormatting -Name 'ID' -ComparisonType number -Operator gt -Value 10000 -Color BlueViolet -Row
TableConditionalFormatting -Name 'Name' -ComparisonType string -Operator eq -Value 'chrome' -Color White -BackgroundColor Crimson -Row
TableConditionalFormatting -Name 'PriorityClass' -ComparisonType string -Operator eq -Value 'Idle' -Color White -BackgroundColor Green
}
}
Tab -Name 'Test 1' -IconBrands adobe {
Section -Name 'Test' -Collapsable {
Table -DataTable $Process -HideFooter {
TableConditionalFormatting -Name 'ID' -ComparisonType number -Operator gt -Value 10000 -Color BlueViolet -Row
TableConditionalFormatting -Name 'Name' -ComparisonType string -Operator eq -Value 'chrome' -Color White -BackgroundColor Crimson -Row
TableConditionalFormatting -Name 'PriorityClass' -ComparisonType string -Operator eq -Value 'Idle' -Color White -BackgroundColor Green
}
}
}
Tab -Name 'Test 2' -IconRegular clone -TextColor Gold -IconColor MediumPurple {
Section -Name 'Test' -Collapsable {
Table -DataTable $Process -HideFooter {
TableConditionalFormatting -Name 'ID' -ComparisonType number -Operator gt -Value 10000 -Color BlueViolet -Row
TableConditionalFormatting -Name 'Name' -ComparisonType string -Operator eq -Value 'chrome' -Color White -BackgroundColor Crimson -Row
TableConditionalFormatting -Name 'PriorityClass' -ComparisonType string -Operator eq -Value 'Idle' -Color White -BackgroundColor Green
}
}
}
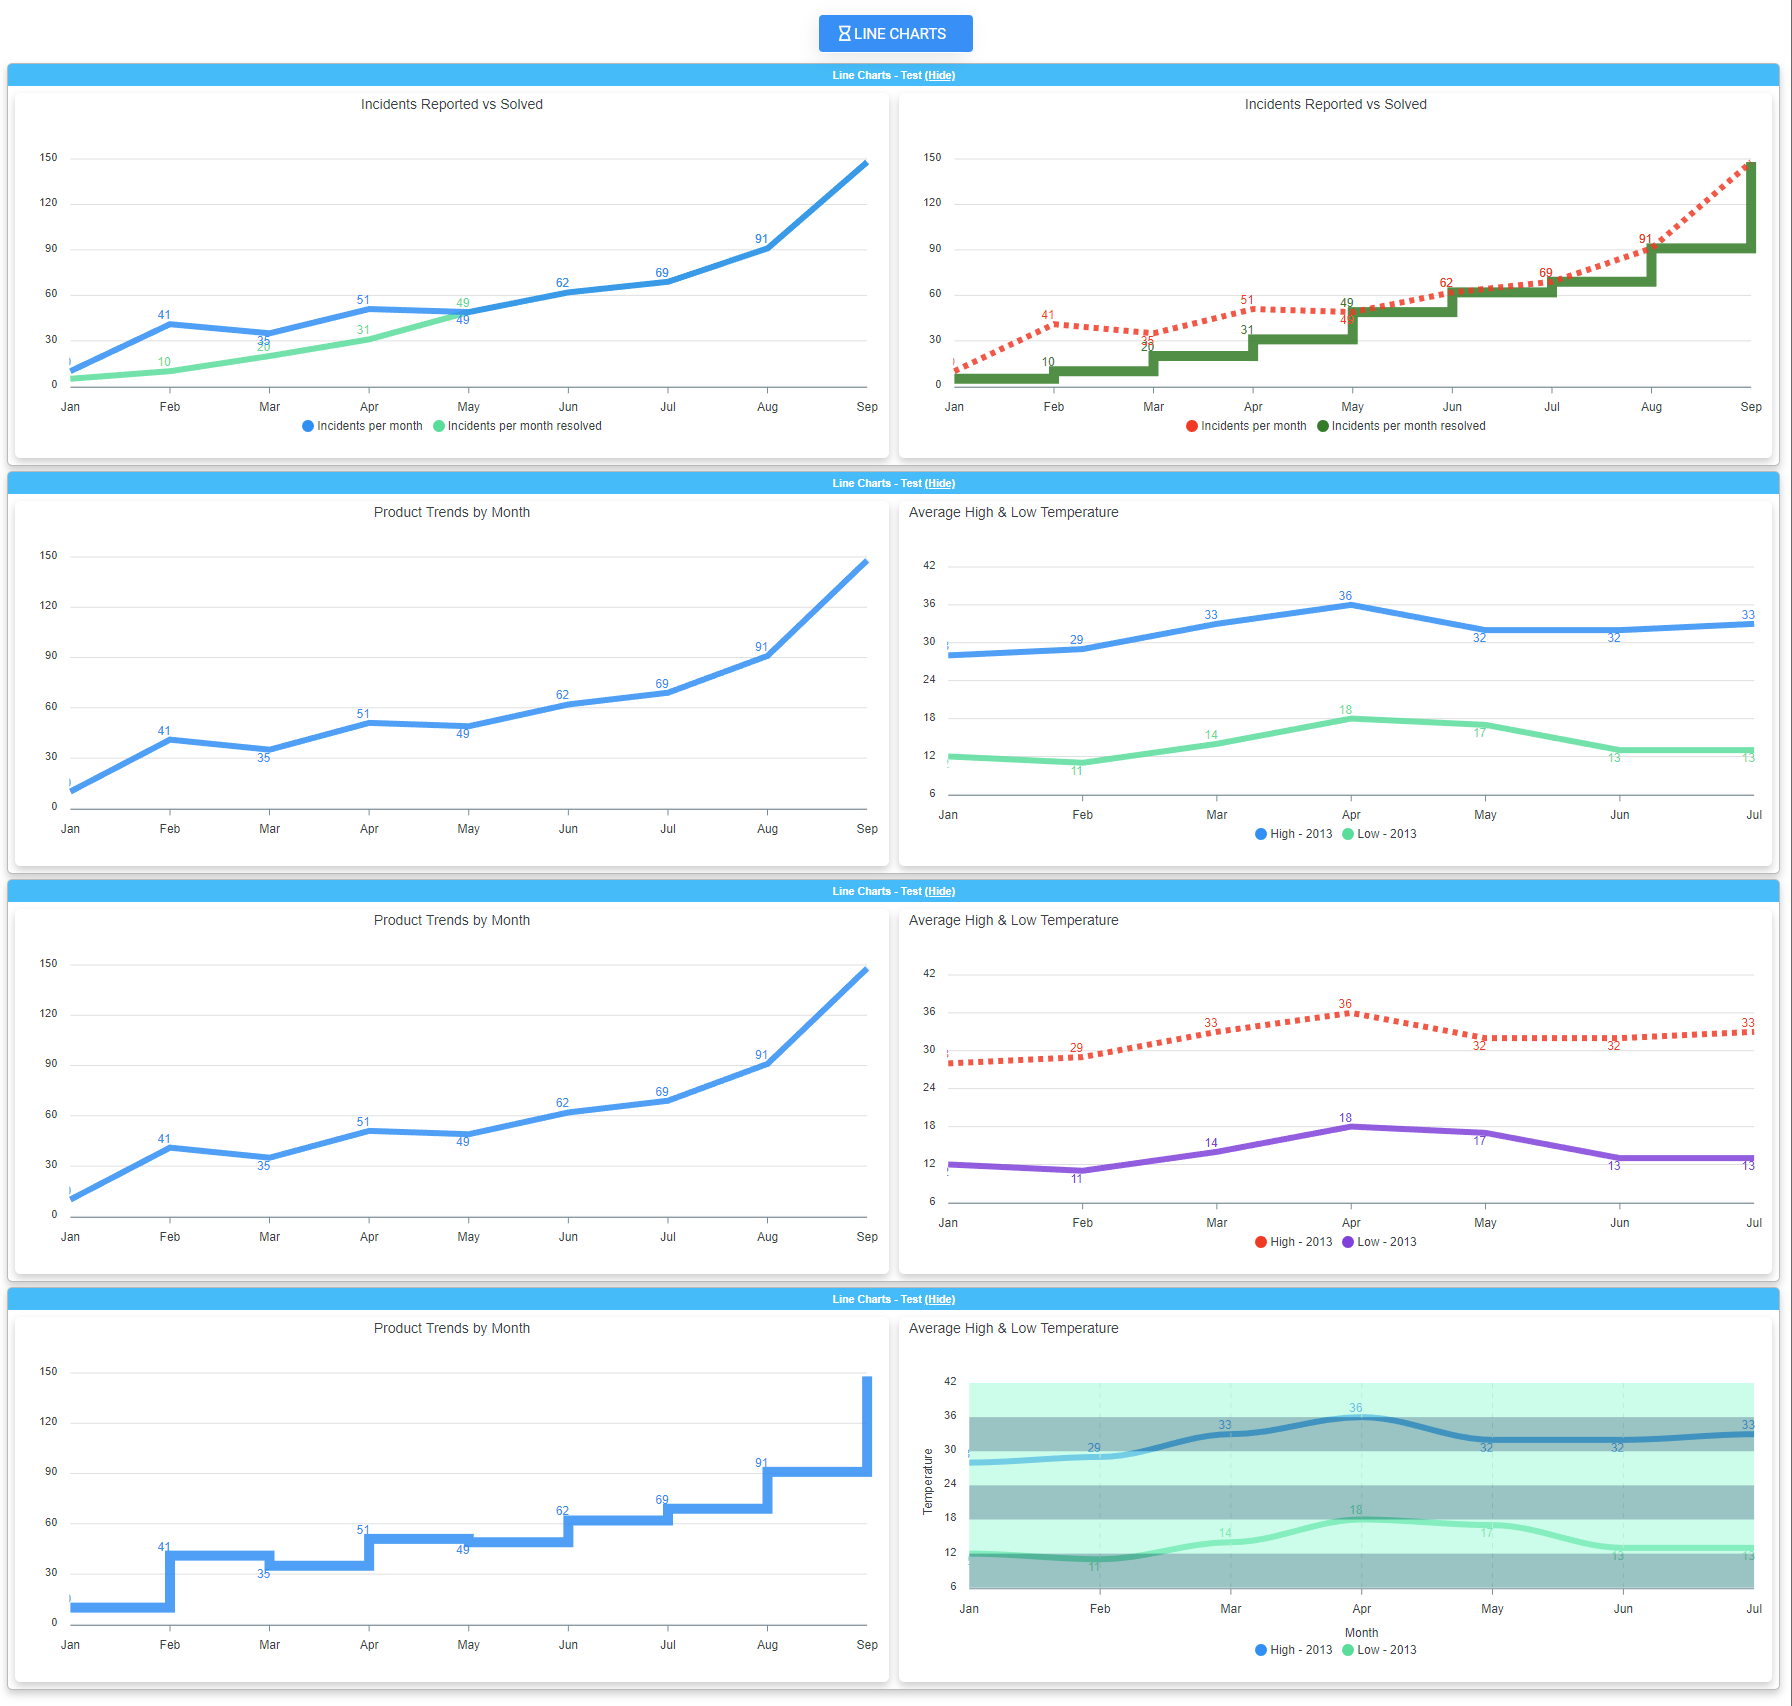
Tab -Name 'Line Charts' -IconRegular hourglass {
Section -Name 'Line Charts - Test' -Collapsable {
Panel {
Chart -Title 'Incidents Reported vs Solved' -TitleAlignment center {
ChartAxisX -Name 'Jan', 'Feb', 'Mar', 'Apr', 'May', 'Jun', 'Jul', 'Aug', 'Sep'
ChartLine -Name 'Incidents per month' -Value 10, 41, 35, 51, 49, 62, 69, 91, 148
ChartLine -Name 'Incidents per month resolved' -Value 5, 10, 20, 31, 49, 62, 69, 91, 148
}
}
Panel {
Chart -Title 'Incidents Reported vs Solved' -TitleAlignment center {
ChartAxisX -Name 'Jan', 'Feb', 'Mar', 'Apr', 'May', 'Jun', 'Jul', 'Aug', 'Sep'
ChartLine -Name 'Incidents per month' -Value 10, 41, 35, 51, 49, 62, 69, 91, 148 -Color Red -Cap square -Dash 5
ChartLine -Name 'Incidents per month resolved' -Value 5, 10, 20, 31, 49, 62, 69, 91, 148 -Color Green -Curve stepline -Width 10
}
}
}
Section -Name 'Line Charts - Test' -Collapsable {
Panel {
Chart -Title 'Product Trends by Month' -TitleAlignment center {
ChartAxisX -Name 'Jan', 'Feb', 'Mar', 'Apr', 'May', 'Jun', 'Jul', 'Aug', 'Sep'
ChartLine -Name 'Desktop' -Value 10, 41, 35, 51, 49, 62, 69, 91, 148
}
}
Panel {
Chart -Title 'Average High & Low Temperature' -TitleAlignment left {
ChartAxisX -Name 'Jan', 'Feb', 'Mar', 'Apr', 'May', 'Jun', 'Jul'
ChartLine -Name "High - 2013" -Value 28, 29, 33, 36, 32, 32, 33 #-Color Red -Cap square -Dash 5
ChartLine -Name "Low - 2013" -Value 12, 11, 14, 18, 17, 13, 13 #-Color Green -Curve stepline -Width 10
}
}
}
Section -Name 'Line Charts - Test' -Collapsable {
Panel {
Chart -Title 'Product Trends by Month' -TitleAlignment center {
ChartAxisX -Name 'Jan', 'Feb', 'Mar', 'Apr', 'May', 'Jun', 'Jul', 'Aug', 'Sep'
ChartLine -Name 'Desktop' -Value 10, 41, 35, 51, 49, 62, 69, 91, 148
}
}
Panel {
Chart -Title 'Average High & Low Temperature' -TitleAlignment left {
ChartAxisX -Name 'Jan', 'Feb', 'Mar', 'Apr', 'May', 'Jun', 'Jul'
ChartLine -Name "High - 2013" -Value 28, 29, 33, 36, 32, 32, 33 -Color Red -Cap square -Dash 5
ChartLine -Name "Low - 2013" -Value 12, 11, 14, 18, 17, 13, 13 -Color BlueViolet
}
}
}
Section -Name 'Line Charts - Test' -Collapsable {
Panel {
Chart -Title 'Product Trends by Month' -TitleAlignment center {
ChartAxisX -Name 'Jan', 'Feb', 'Mar', 'Apr', 'May', 'Jun', 'Jul', 'Aug', 'Sep'
ChartLine -Name 'Desktop' -Value 10, 41, 35, 51, 49, 62, 69, 91, 148 -Curve stepline -Width 10
}
}
Panel {
Chart -Title 'Average High & Low Temperature' -TitleAlignment left {
# This controls how the grid looks like
ChartGrid -Show -Position front -xAxisLinesShow -StrokeDash 5 -RowColors Aquamarine, DarkCyan
# This is category (responsible for values on axis X)
ChartAxisX -Name 'Jan', 'Feb', 'Mar', 'Apr', 'May', 'Jun', 'Jul' -TitleText 'Month'
ChartAxisY -TitleText 'Temperature' -Show -ShowAlways
# Data and control of data
ChartLine -Name "High - 2013" -Value 28, 29, 33, 36, 32, 32, 33 -Curve smooth #-Color Red -Cap square -Dash 5
ChartLine -Name "Low - 2013" -Value 12, 11, 14, 18, 17, 13, 13 -Curve smooth #-Color Green -Curve stepline -Width 10
}
}
}
}
}
💡 Bar Charts – Different options
Below you can find the code to show you different ways to build Bar Charts
Import-Module Dashimo -Force

Dashboard -Name 'Charts - Bar' -FilePath $PSScriptRoot\Output\DashboardChartsBar.html {
    TabOptions -SlimTabs
    Tab -Name 'Bar Charts - Bar' -IconRegular chart-bar {
        Section -Name 'Bar Charts - Test' -Collapsable {
            Panel {
                Chart {
                    ChartLegend -Name 'Time'
                    ChartBar -Name 'Test' -Value 1
                    ChartBar -Name 'Test1' -Value 2
                    ChartBar -Name 'Test2' -Value 3
                }
            }
            Panel {
                Chart {
                    ChartToolbar -Download
                    ChartLegend -Name 'Time', 'Money', 'Taxes'
                    ChartBar -Name 'Test' -Value 1, 2, 3
                    ChartBar -Name 'Test1' -Value 2, 5, 7
                    ChartBar -Name 'Test2' -Value 3, 1, 2
                }
            }
            Panel {
                Chart {
                    ChartLegend -Name 'Time'
                    for ($i = 0; $i -le 5; $i++) {
                        ChartBar -Name "Test $i" -Value $i
                    }
                }
            }
            Panel {
                Chart {
                    ChartBarOptions -Vertical -DataLabelsColor GreenYellow
                    ChartLegend -Name 'Time'
                    for ($i = 0; $i -le 5; $i++) {
                        ChartBar -Name "Test $i" -Value $i
                    }
                }
            }
        }
        Section -Name 'Bar Charts - Test Colors' -Collapsable {
            Panel -Invisible {
                Chart {
                    ChartLegend -Name 'Time'
                    ChartBar -Name 'Test' -Value 1
                    ChartBar -Name 'Test1' -Value 2
                    ChartBar -Name 'Test2' -Value 3
                }
            }
            Panel -Invisible {
                Chart {
                    ChartLegend -Name 'Time', 'Money', 'Taxes'
                    ChartBar -Name 'Test' -Value 1, 2, 3
                    ChartBar -Name 'Test1' -Value 2, 5, 7
                    ChartBar -Name 'Test2' -Value 3, 1, 2
                }
            }
            Panel -Invisible {
                Chart {
                    ChartLegend -Name 'Time'
                    for ($i = 0; $i -le 5; $i++) {
                        ChartBar -Name "Test $i" -Value $i
                    }
                }
            }
            Panel -Invisible {
                Chart {
                    ChartBarOptions -Vertical -DataLabelsColor GreenYellow
                    ChartLegend -Name 'Time'
                    for ($i = 0; $i -le 5; $i++) {
                        ChartBar -Name "Test $i" -Value $i
                    }
                }
            }
        }
        Section -Name 'Bar Charts - Standard Bar' -Collapsable {

            Panel {
                $Data1 = 400, 430, 448, 470, 540, 580, 690, 1100, 1200, 1380
                $DataNames1 = 'South Korea', 'Canada', 'United Kingdom', 'Netherlands', 'Italy', 'France', 'Japan', 'United States', 'China', 'Germany'
                Chart {
                    ChartLegend -Name 'Number of bottles'
                    for ($i = 0; $i -lt $Data1.Count; $i++) {
                        ChartBar -Name $DataNames1[$i] -Value $Data1[$i]
                    }
                }
            }

            Panel {
                $Data1 = 44, 55, 41, 64, 22, 43, 21
                $Data2 = 53, 32, 33, 52, 13, 44, 32
                $DataNames1 = 2001, 2002, 2003, 2004, 2005, 2006, 2007

                Chart -Title 'Born vs Dead' -TitleAlignment center {
                    #ChartBarOptions
                    ChartLegend -Name 'Born', 'Died'
                    for ($i = 0; $i -lt $Data1.Count; $i++) {
                        ChartBar -Name $DataNames1[$i] -Value $Data1[$i], $Data2[$i]
                    }
                }
            }
        }
        Section -Name 'Bar Charts - Standard Bar Vertical' -Collapsable {

            Panel {
                $Data1 = 400, 430, 448, 470, 540, 580, 690, 1100, 1200, 1380
                $DataNames1 = 'South Korea', 'Canada', 'United Kingdom', 'Netherlands', 'Italy', 'France', 'Japan', 'United States', 'China', 'Germany'
                Chart {
                    ChartBarOptions -Vertical
                    ChartLegend -Name 'Number of bottles'
                    for ($i = 0; $i -lt $Data1.Count; $i++) {
                        ChartBar -Name $DataNames1[$i] -Value $Data1[$i]
                    }
                }
            }

            Panel {
                $Data1 = 44, 55, 41, 64, 22, 43, 21
                $Data2 = 53, 32, 33, 52, 13, 44, 32
                $DataNames1 = 2001, 2002, 2003, 2004, 2005, 2006, 2007

                Chart -Title 'Born vs Dead' -TitleAlignment center {
                    ChartBarOptions -Vertical
                    ChartLegend -Name 'Born', 'Died'
                    for ($i = 0; $i -lt $Data1.Count; $i++) {
                        ChartBar -Name $DataNames1[$i] -Value $Data1[$i], $Data2[$i]
                    }
                }
            }
        }
        Section -Name 'Bar Charts - Standard Bar Vertical & Patterned' -Collapsable {

            Panel {
                $Data1 = 400, 430, 448, 470, 540, 580, 690, 1100, 1200, 1380
                $DataNames1 = 'South Korea', 'Canada', 'United Kingdom', 'Netherlands', 'Italy', 'France', 'Japan', 'United States', 'China', 'Germany'
                Chart {
                    ChartBarOptions -Vertical -Patterned
                    ChartLegend -Name 'Number of bottles'
                    for ($i = 0; $i -lt $Data1.Count; $i++) {
                        ChartBar -Name $DataNames1[$i] -Value $Data1[$i]
                    }
                }
            }

            Panel {
                $Data1 = 44, 55, 41, 64, 22, 43, 21
                $Data2 = 53, 32, 33, 52, 13, 44, 32
                $DataNames1 = 2001, 2002, 2003, 2004, 2005, 2006, 2007

                Chart -Title 'Born vs Dead' -TitleAlignment center {
                    ChartBarOptions -Vertical -Patterned
                    ChartLegend -Name 'Born', 'Died'
                    for ($i = 0; $i -lt $Data1.Count; $i++) {
                        ChartBar -Name $DataNames1[$i] -Value $Data1[$i], $Data2[$i]
                    }
                }
            }
        }
    }
    Tab -Name 'Bar Charts - Bar Stacked' -IconRegular chart-bar {

        Section -Name 'Bar Charts 1 - Bar Stacked' -Collapsable {
            # One way to build charts but with 2 values
            Panel {
                $Data1 = 400, 430, 448, 470, 540, 580, 690, 1100, 1200, 1380
                $Data2 = 44, 55, 41, 64, 22, 43, 21
                $Data3 = 53, 32, 33, 52, 13, 44, 32
                $DataNames1 = 'South Korea', 'Canada', 'United Kingdom', 'Netherlands', 'Italy', 'France', 'Japan', 'United States', 'China', 'Germany'

                Chart {
                    ChartBarOptions -Type barStacked
                    ChartLegend -Name 'People', 'Pets', 'Furniture'
                    for ($i = 0; $i -lt $Data1.Count; $i++) {
                        ChartBar -Name $DataNames1[$i] -Value $Data1[$i], $Data2[$i], $Data3[$i]
                    }
                }
            }
            Panel {
                $DataNames1 = 2001, 2002, 2003, 2004, 2005, 2006, 2007
                Chart -Title 'Pets vs People' -TitleAlignment center {
                    ChartBarOptions -Type barStacked
                    ChartLegend -Name 'People', 'Pets'
                    ChartBar -Name $DataNames1[0] -Value 44, 53
                    ChartBar -Name $DataNames1[1] -Value 55, 32
                    ChartBar -Name $DataNames1[2] -Value 41, 33
                    ChartBar -Name $DataNames1[3] -Value 64, 52
                    ChartBar -Name $DataNames1[4] -Value 22, 13
                    ChartBar -Name $DataNames1[5] -Value 43, 44
                    ChartBar -Name $DataNames1[6] -Value 21, 32
                }
            }
        }
    }
    Tab -Name 'Bar Charts - Bar Stacked 100%' -IconSolid audio-description {
        Section -Name 'Bar Charts - Stacked 100%' -Collapsable {
            Panel {
                $Data1 = 44, 55, 41, 37, 22, 43, 21
                $Data2 = 53, 32, 33, 52, 13, 43, 32
                $Data3 = 12, 17, 11, 9, 15, 11, 20
                $Data4 = 9, 7, 5, 8, 6, 9, 4
                $Data5 = 25, 12, 19, 32, 25, 24, 10
                $DataNames1 = 2008, 2009, 2010, 2011, 2012, 2013, 2014
                Chart -Title 'Finctional Books Sales' {
                    ChartBarOptions -Type barStacked100Percent
                    ChartLegend -Names 'Marine Sprite', 'Striking Calf', 'Tank Picture', 'Tank Picture', 'Bucket Slope', 'Reborn Kid', 'Other' -LegendPosition top
                    for ($i = 0; $i -lt $Data1.Count; $i++) {
                        ChartBar -Name $DataNames1[$i] -Value $Data1[$i], $Data2[$i], $Data3[$i], $Data4[$i], $Data5[$i]
                    }
                }
            }
            Panel {
                $Data1 = 44, 55, 41, 64, 22, 43, 21
                $Data2 = 53, 32, 33, 52, 13, 44, 32
                $DataNames1 = 2001, 2002, 2003, 2004, 2005, 2006, 2007
                Chart -Title 'Pets vs People' -TitleAlignment center {
                    ChartBarOptions -Type barStacked100Percent
                    ChartLegend -Names 'People', 'Pets' -LegendPosition bottom
                    for ($i = 0; $i -lt $Data1.Count; $i++) {
                        ChartBar -Name $DataNames1[$i] -Value $Data1[$i], $Data2[$i]
                    }
                }
            }
        }
    }
    Tab -Name 'Bar Charts - Bar Stacked Plus/Minus' -IconRegular file {
        Section -Name 'Bar Charts - Stacked 100%' -Collapsable {
            Panel {
                $Data1 = -0.8, -1.05, -1.06, -1.18, -1.4, -2.2, -2.85, -3.7, -3.96, -4.22, -4.3, -4.4, -4.1, -4, -4.1, -3.4, -3.1, -2.8
                $Data2 = 0.4, 0.65, 0.76, 0.88, 1.5, 2.1, 2.9, 3.8, 3.9, 4.2, 4, 4.3, 4.1, 4.2, 4.5, 3.9, 3.5, 3
                $DataLegend = 'Males', 'Females' # should match amount of data sets
                $DataNames = '85+', '80-84', '75-79', '70-74', '65-69', '60-64', '55-59', '50-54', '45-49', '40-44', '35-39', '30-34', '25-29', '20-24', '15-19', '10-14', '5-9', '0-4'

                Chart -Title 'Mauritius population pyramid 2011' {
                    ChartBarOptions -Type barStacked
                    ChartLegend -Names $DataLegend -LegendPosition top
                    for ($i = 0; $i -lt $Data1.Count; $i++) {
                        ChartBar -Name $DataNames[$i] -Value $Data1[$i], $Data2[$i]
                    }
                }

                #ChartBar -Data $Data1, $Data2 -DataNames $DataNames -DataLegend $DataLegend -Type barStacked -DataLabelsEnabled $true -Height 500

            }
            Panel {
                $Data1 = -0.8, -1.05, -1.06, -1.18, -1.4, -2.2, -2.85, -3.7, -3.96, -4.22, -4.3, -4.4, -4.1, -4, -4.1, -3.4, -3.1, -2.8
                $Data2 = 0.4, 0.65, 0.76, 0.88, 1.5, 2.1, 2.9, 3.8, 3.9, 4.2, 4, 4.3, 4.1, 4.2, 4.5, 3.9, 3.5, 3
                $DataLegend = 'Males', 'Females' # should match amount of data sets
                $DataNames = '85+', '80-84', '75-79', '70-74', '65-69', '60-64', '55-59', '50-54', '45-49', '40-44', '35-39', '30-34', '25-29', '20-24', '15-19', '10-14', '5-9', '0-4'

                Chart -Title 'Mauritius population pyramid 2011' {
                    ChartBarOptions -Type barStacked -Vertical
                    ChartLegend -Names $DataLegend -LegendPosition top
                    for ($i = 0; $i -lt $Data1.Count; $i++) {
                        ChartBar -Name $DataNames[$i] -Value $Data1[$i], $Data2[$i]
                    }
                }
            }
        }
    }
} -Show
And here's how it will look like
💡 Line Charts – Different options
The same approach applies to line charts. Below you can find some examples on how you can configure charts to match your style.
Import-Module Dashimo -Force

Dashboard -Name 'Charts - Line' -FilePath $PSScriptRoot\Output\DashboardChartsLine.html {
    TabOptions -SlimTabs
    Tab -Name 'Line Charts' -IconRegular hourglass {
        Section -Name 'Line Charts - Test' -Collapsable {
            Panel {
                Chart -Title 'Incidents Reported vs Solved' -TitleAlignment center {
                    ChartAxisX -Name 'Jan', 'Feb', 'Mar', 'Apr', 'May', 'Jun', 'Jul', 'Aug', 'Sep'
                    ChartLine -Name 'Incidents per month' -Value 10, 41, 35, 51, 49, 62, 69, 91, 148
                    ChartLine -Name 'Incidents per month resolved' -Value 5, 10, 20, 31, 49, 62, 69, 91, 148
                }
            }
            Panel {
                Chart -Title 'Incidents Reported vs Solved' -TitleAlignment center {
                    ChartAxisX -Name 'Jan', 'Feb', 'Mar', 'Apr', 'May', 'Jun', 'Jul', 'Aug', 'Sep'
                    ChartLine -Name 'Incidents per month' -Value 10, 41, 35, 51, 49, 62, 69, 91, 148 -Color Red -Cap square -Dash 5
                    ChartLine -Name 'Incidents per month resolved' -Value 5, 10, 20, 31, 49, 62, 69, 91, 148 -Color Green -Curve stepline -Width 10
                }
            }

        }
        Section -Name 'Line Charts - Test' -Collapsable {
            Panel {
                Chart -Title 'Product Trends by Month' -TitleAlignment center {
                    ChartAxisX -Name 'Jan', 'Feb', 'Mar', 'Apr', 'May', 'Jun', 'Jul', 'Aug', 'Sep'
                    ChartLine -Name 'Desktop' -Value 10, 41, 35, 51, 49, 62, 69, 91, 148
                }
            }
            Panel {
                Chart -Title 'Average High & Low Temperature' -TitleAlignment left {
                    ChartAxisX -Name 'Jan', 'Feb', 'Mar', 'Apr', 'May', 'Jun', 'Jul'
                    ChartLine -Name "High - 2013" -Value 28, 29, 33, 36, 32, 32, 33 #-Color Red -Cap square -Dash 5
                    ChartLine -Name  "Low - 2013" -Value 12, 11, 14, 18, 17, 13, 13 #-Color Green -Curve stepline -Width 10
                }
            }

        }
        Section -Name 'Line Charts - Test' -Collapsable {
            Panel {
                Chart -Title 'Product Trends by Month' -TitleAlignment center {
                    ChartAxisX -Name 'Jan', 'Feb', 'Mar', 'Apr', 'May', 'Jun', 'Jul', 'Aug', 'Sep'
                    ChartLine -Name 'Desktop' -Value 10, 41, 35, 51, 49, 62, 69, 91, 148
                }
            }
            Panel {
                Chart -Title 'Average High & Low Temperature' -TitleAlignment left {
                    ChartAxisX -Name 'Jan', 'Feb', 'Mar', 'Apr', 'May', 'Jun', 'Jul'
                    ChartLine -Name "High - 2013" -Value 28, 29, 33, 36, 32, 32, 33 -Color Red -Cap square -Dash 5
                    ChartLine -Name  "Low - 2013" -Value 12, 11, 14, 18, 17, 13, 13 -Color BlueViolet

                }
            }

        }
        Section -Name 'Line Charts - Test' -Collapsable {
            Panel {
                Chart -Title 'Product Trends by Month' -TitleAlignment center {
                    ChartAxisX -Name 'Jan', 'Feb', 'Mar', 'Apr', 'May', 'Jun', 'Jul', 'Aug', 'Sep'
                    ChartLine -Name 'Desktop' -Value 10, 41, 35, 51, 49, 62, 69, 91, 148 -Curve stepline -Width 10
                }
            }
            Panel {
                Chart -Title 'Average High & Low Temperature' -TitleAlignment left {
                    # This controls how the grid looks like
                    ChartGrid -Show -Position front -xAxisLinesShow -StrokeDash 5 -RowColors Aquamarine, DarkCyan
                    # This is category (responsible for values on axis X)
                    ChartAxisX -Name 'Jan', 'Feb', 'Mar', 'Apr', 'May', 'Jun', 'Jul' -TitleText 'Month'
                    ChartAxisY -TitleText 'Temperature' -Show -ShowAlways
                    # Data and control of data
                    ChartLine -Name "High - 2013" -Value 28, 29, 33, 36, 32, 32, 33 -Curve smooth #-Color Red -Cap square -Dash 5
                    ChartLine -Name  "Low - 2013" -Value 12, 11, 14, 18, 17, 13, 13 -Curve smooth #-Color Green -Curve stepline -Width 10

                }
            }

        }
    }
} -Show
💡 Font awesome icons in Tabs
As mentioned in the begining you can now use one of 1400 icons in tabs. You have three choices. IconRegular, IconSolid, and IconBrands. Below screenshot shows some of them.

You can size those icons, you can size text, you can change colors making it your own. Not only that but you can now control tabs selector color, transition, linear gradient. If you don't use TabOptions it will take defaults. But if you're into that kind of customization, be my guest.
💡 Paging Option / Paging Length
You can now also control Page Length for Tables. Paging options allow you to define user choices.
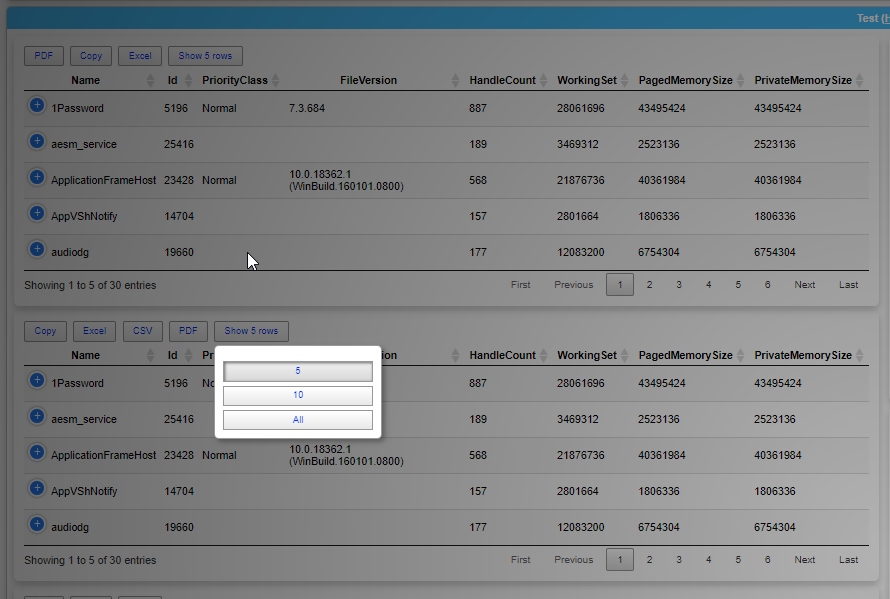
It's as simple as defining a new array with proper values.
Panel {
        Table -DataTable $Process -DisableSearch -HideFooter -PagingOptions @(5, 10)
}
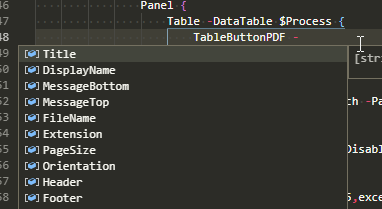
💡 Controlling Table Buttons
It used to be possible to control availability of export buttons with Buttons parameter. It only allowed customization on what should appear as an export option. No export options would be an empty array, and if you wanted export to excel, csv or others you would need to give all buttons as an array.
Panel {
    Table -DataTable $Process -Buttons copyHtml5,excelHtml5,pdfHtml5 -DisableSearch -DisablePaging -HideFooter
}
Panel {
    Table -DataTable $Process {
        TableButtonPDF -PageSize A10 -Orientation landscape
        TableButtonCopy
        TableButtonExcel
    } -Buttons @() -DisableSearch -DisablePaging -HideFooter
}
But it only controlled what shown up. With the new version, you can define buttons separately. The moment you add TableButtonPDF command or similar Buttons parameter doesn't matter. For now, only TableButtonPDF got multiple options to choose from, and rest of the TableButton commands are mostly there to add a button, but surely I will add more customizations here so one can name the button as he/she wants to. To give you some ideas here's a bunch of options for TableButtonPDF customization.
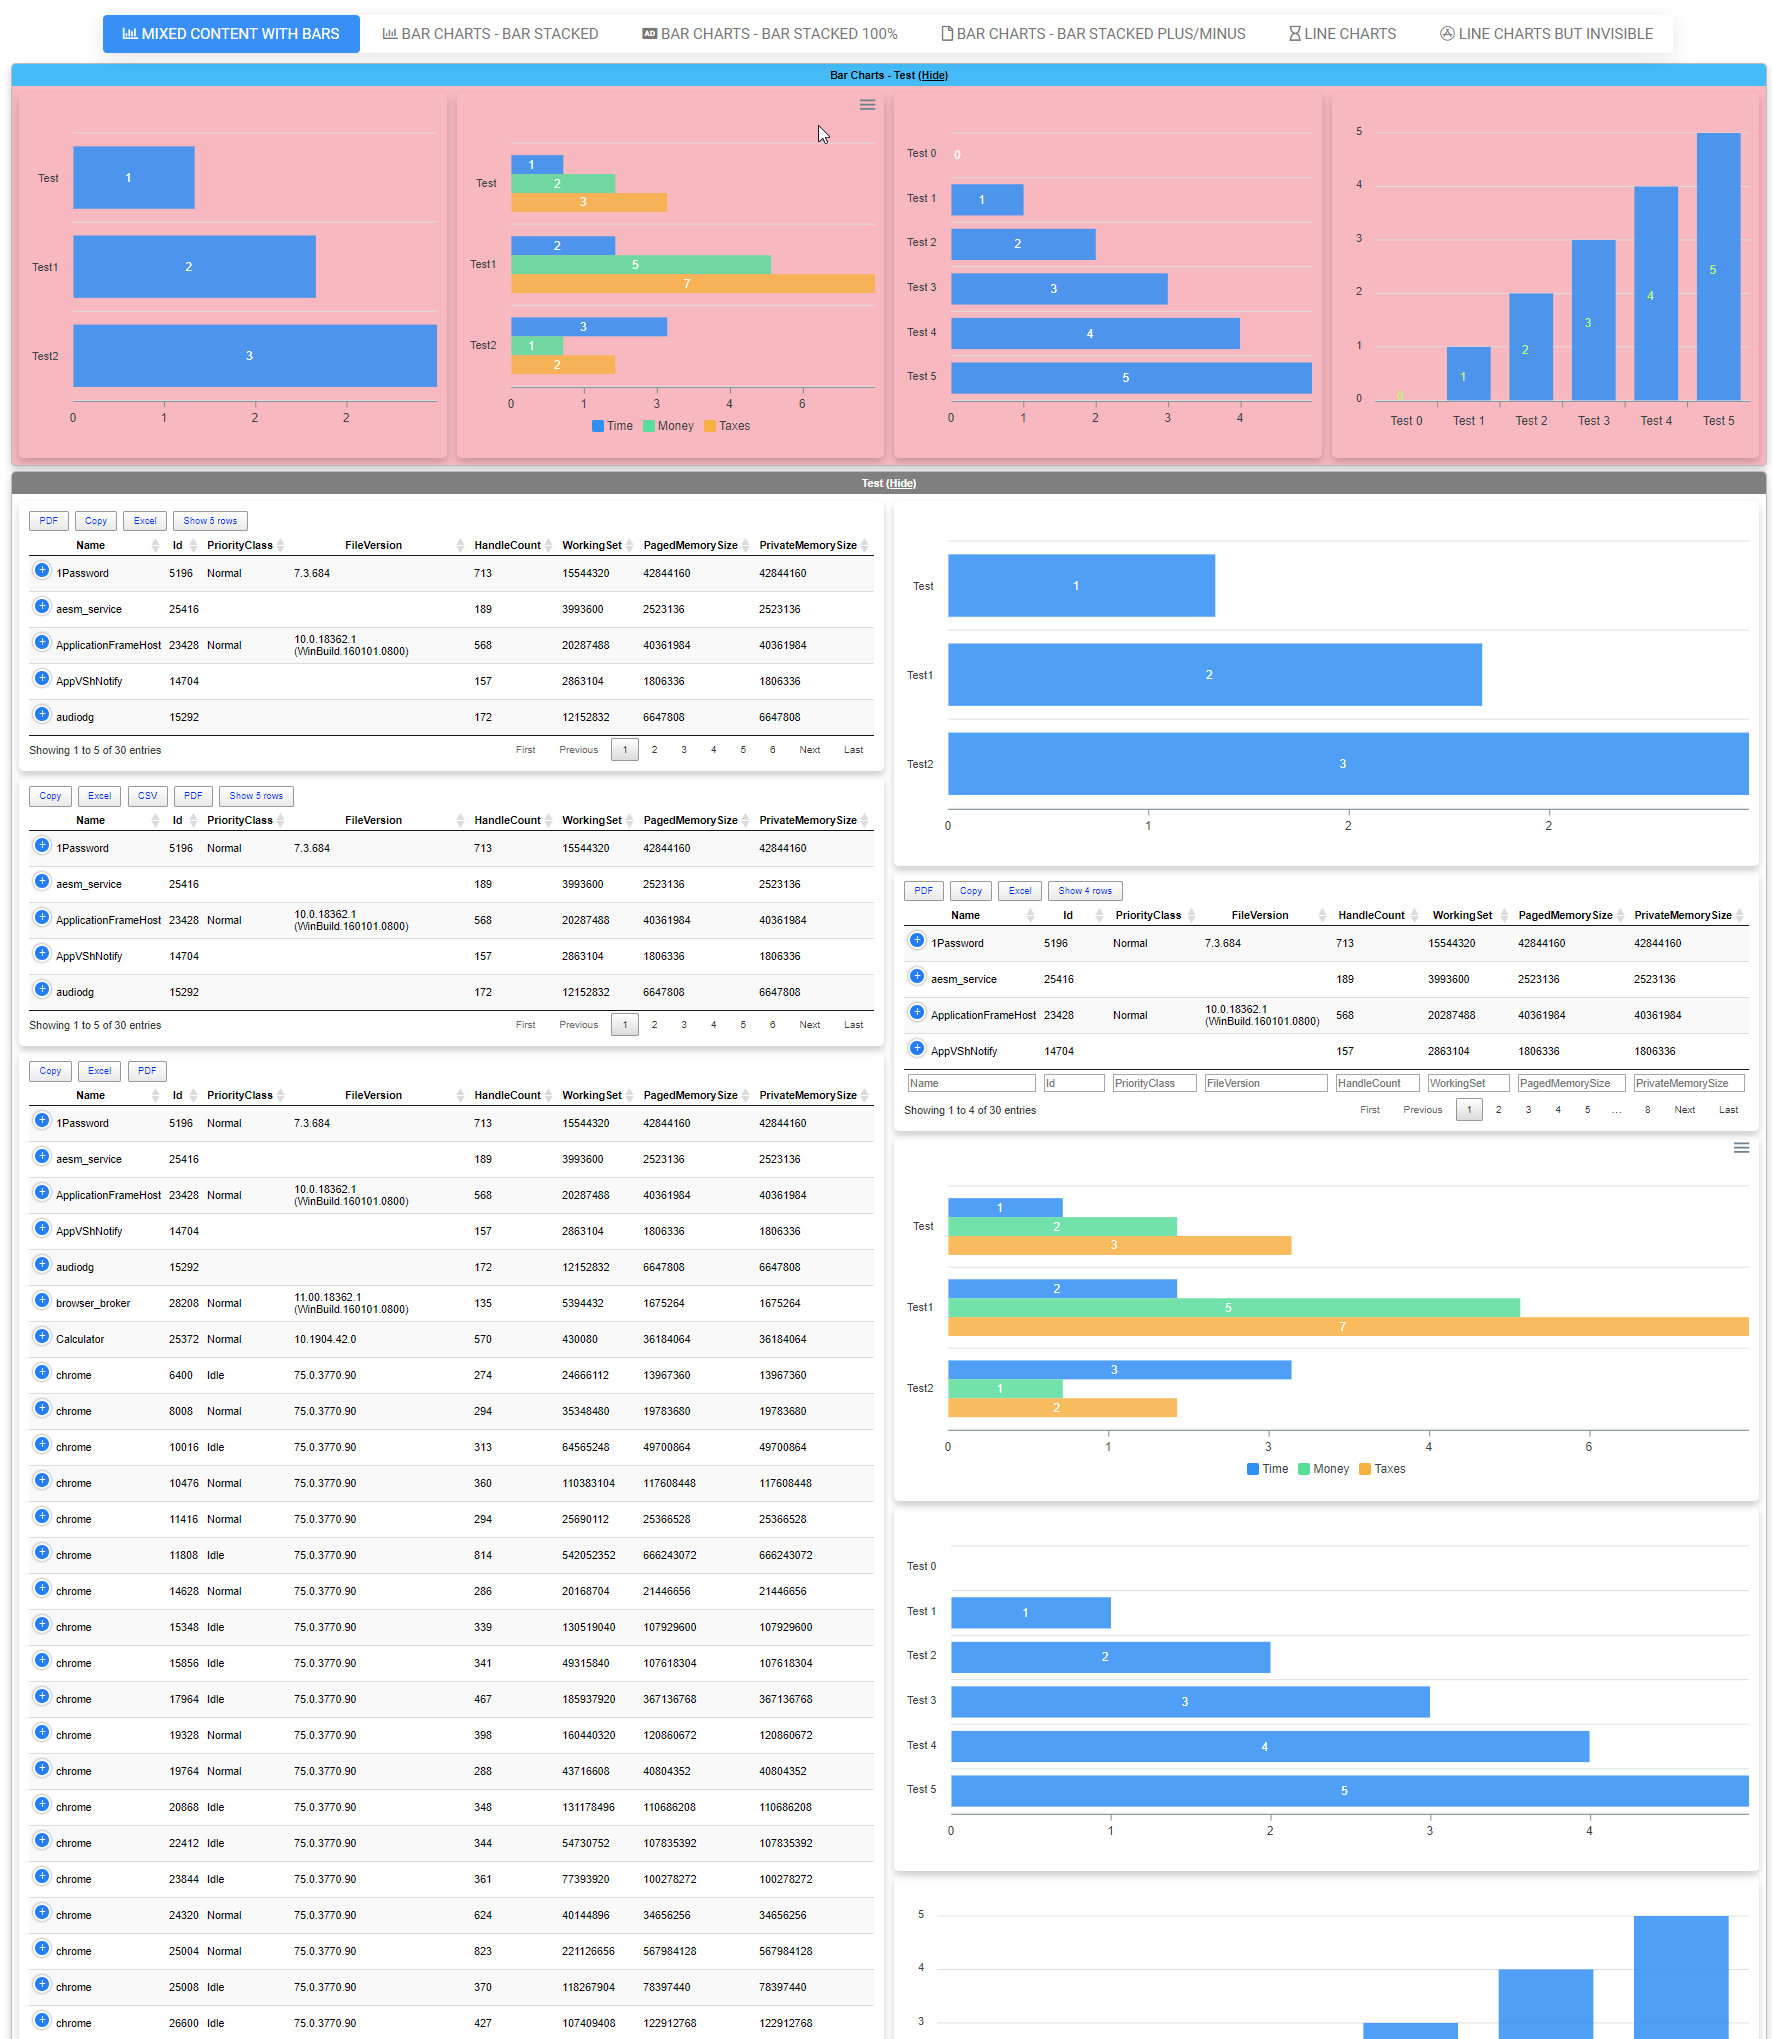
💡 Complicated Example
Here's the most complicated example with a lot of features in use. You can find how it looks here or simply run the code yourself.
Import-Module Dashimo -Force
$Process = Get-Process | Select-Object -First 30
Dashboard -Name 'Mixed Content Example' -FilePath $PSScriptRoot\Output\DashboardMixedContent.html {
TabOptions -SlimTabs
Tab -Name 'Mixed content with Bars' -IconRegular chart-bar {
Section -Name 'Bar Charts - Test' -Collapsable -BackgroundColor LightPink -TextColor Black {
Panel {
Chart {
ChartLegend -Name 'Time'
ChartBar -Name 'Test' -Value 1
ChartBar -Name 'Test1' -Value 2
ChartBar -Name 'Test2' -Value 3
}
}
Panel {
Chart {
ChartToolbar -Download
ChartLegend -Name 'Time', 'Money', 'Taxes'
ChartBar -Name 'Test' -Value 1, 2, 3
ChartBar -Name 'Test1' -Value 2, 5, 7
ChartBar -Name 'Test2' -Value 3, 1, 2
}
}
Panel {
Chart {
ChartLegend -Name 'Time'
for ($i = 0; $i -le 5; $i++) {
ChartBar -Name "Test $i" -Value $i
}
}
}
Panel {
Chart {
ChartBarOptions -Vertical -DataLabelsColor GreenYellow
ChartLegend -Name 'Time'
for ($i = 0; $i -le 5; $i++) {
ChartBar -Name "Test $i" -Value $i
}
}
}
}
Section -Name 'Test' -Collapsable -TextBackGroundColor Gray {
Container {
Panel {
Table -DataTable $Process {
TableButtonPDF -
TableButtonCopy
TableButtonExcel
TableButtonPageLength
} -Buttons @() -DisableSearch -PagingOptions @(5, 10) -HideFooter
}
Panel {
Table -DataTable $Process -DisableSearch -HideFooter -PagingOptions @(5, 10)
}
Panel {
Table -DataTable $Process -Buttons copyHtml5, excelHtml5, pdfHtml5 -DisableSearch -DisablePaging
}
}
Container {
Panel {
Chart {
ChartLegend -Name 'Time'
ChartBar -Name 'Test' -Value 1
ChartBar -Name 'Test1' -Value 2
ChartBar -Name 'Test2' -Value 3
}
}
Panel {
Table -DataTable $Process {
TableButtonPDF
TableButtonCopy
TableButtonExcel
TableButtonPageLength
} -DisableSearch -PagingOptions @(4, 8) -Filtering
}
Panel {
Chart {
ChartToolbar -Download
ChartLegend -Name 'Time', 'Money', 'Taxes'
ChartBar -Name 'Test' -Value 1, 2, 3
ChartBar -Name 'Test1' -Value 2, 5, 7
ChartBar -Name 'Test2' -Value 3, 1, 2
}
}
Panel {
Chart {
ChartLegend -Name 'Time'
for ($i = 0; $i -le 5; $i++) {
ChartBar -Name "Test $i" -Value $i
}
}
}
Panel {
Chart {
ChartBarOptions -Vertical -DataLabelsColor GreenYellow
ChartLegend -Name 'Time'
for ($i = 0; $i -le 5; $i++) {
ChartBar -Name "Test $i" -Value $i
}
}
}
}
}
Section -Name 'Bar Charts - Test Colors' -TextColor PaleVioletRed {
Panel -Invisible {
Chart {
ChartLegend -Name 'Time'
ChartBar -Name 'Test' -Value 1
ChartBar -Name 'Test1' -Value 2
ChartBar -Name 'Test2' -Value 3
}
}
Panel -Invisible {
Chart {
ChartLegend -Name 'Time', 'Money', 'Taxes'
ChartBar -Name 'Test' -Value 1, 2, 3
ChartBar -Name 'Test1' -Value 2, 5, 7
ChartBar -Name 'Test2' -Value 3, 1, 2
}
}
Panel -Invisible {
Chart {
ChartLegend -Name 'Time'
for ($i = 0; $i -le 5; $i++) {
ChartBar -Name "Test $i" -Value $i
}
}
}
Panel -Invisible {
Chart {
ChartBarOptions -Vertical -DataLabelsColor GreenYellow
ChartLegend -Name 'Time'
for ($i = 0; $i -le 5; $i++) {
ChartBar -Name "Test $i" -Value $i
}
}
}
}
Section -Name 'Bar Charts - Standard Bar' -Collapsable {
Panel {
$Data1 = 400, 430, 448, 470, 540, 580, 690, 1100, 1200, 1380
$DataNames1 = 'South Korea', 'Canada', 'United Kingdom', 'Netherlands', 'Italy', 'France', 'Japan', 'United States', 'China', 'Germany'
Chart {
ChartLegend -Name 'Number of bottles'
for ($i = 0; $i -lt $Data1.Count; $i++) {
ChartBar -Name $DataNames1[$i] -Value $Data1[$i]
}
}
}
Panel {
$Data1 = 44, 55, 41, 64, 22, 43, 21
$Data2 = 53, 32, 33, 52, 13, 44, 32
$DataNames1 = 2001, 2002, 2003, 2004, 2005, 2006, 2007
Chart -Title 'Born vs Dead' -TitleAlignment center {
#ChartBarOptions
ChartLegend -Name 'Born', 'Died'
for ($i = 0; $i -lt $Data1.Count; $i++) {
ChartBar -Name $DataNames1[$i] -Value $Data1[$i], $Data2[$i]
}
}
}
}
Section -Name 'Bar Charts - Standard Bar Vertical' -Collapsable {
Panel {
$Data1 = 400, 430, 448, 470, 540, 580, 690, 1100, 1200, 1380
$DataNames1 = 'South Korea', 'Canada', 'United Kingdom', 'Netherlands', 'Italy', 'France', 'Japan', 'United States', 'China', 'Germany'
Chart {
ChartBarOptions -Vertical
ChartLegend -Name 'Number of bottles'
for ($i = 0; $i -lt $Data1.Count; $i++) {
ChartBar -Name $DataNames1[$i] -Value $Data1[$i]
}
}
}
Panel {
$Data1 = 44, 55, 41, 64, 22, 43, 21
$Data2 = 53, 32, 33, 52, 13, 44, 32
$DataNames1 = 2001, 2002, 2003, 2004, 2005, 2006, 2007
Chart -Title 'Born vs Dead' -TitleAlignment center {
ChartBarOptions -Vertical
ChartLegend -Name 'Born', 'Died'
for ($i = 0; $i -lt $Data1.Count; $i++) {
ChartBar -Name $DataNames1[$i] -Value $Data1[$i], $Data2[$i]
}
}
}
}
Section -Name 'Bar Charts - Standard Bar Vertical & Patterned' -Collapsable {
Panel {
$Data1 = 400, 430, 448, 470, 540, 580, 690, 1100, 1200, 1380
$DataNames1 = 'South Korea', 'Canada', 'United Kingdom', 'Netherlands', 'Italy', 'France', 'Japan', 'United States', 'China', 'Germany'
Chart {
ChartBarOptions -Vertical -Patterned
ChartLegend -Name 'Number of bottles'
for ($i = 0; $i -lt $Data1.Count; $i++) {
ChartBar -Name $DataNames1[$i] -Value $Data1[$i]
}
}
}
Panel {
$Data1 = 44, 55, 41, 64, 22, 43, 21
$Data2 = 53, 32, 33, 52, 13, 44, 32
$DataNames1 = 2001, 2002, 2003, 2004, 2005, 2006, 2007
Chart -Title 'Born vs Dead' -TitleAlignment center {
ChartBarOptions -Vertical -Patterned
ChartLegend -Name 'Born', 'Died'
for ($i = 0; $i -lt $Data1.Count; $i++) {
ChartBar -Name $DataNames1[$i] -Value $Data1[$i], $Data2[$i]
}
}
}
}
}
Tab -Name 'Bar Charts - Bar Stacked' -IconRegular chart-bar {
Section -Name 'Bar Charts 1 - Bar Stacked' -Collapsable {
# One way to build charts but with 2 values
Panel {
$Data1 = 400, 430, 448, 470, 540, 580, 690, 1100, 1200, 1380
$Data2 = 44, 55, 41, 64, 22, 43, 21
$Data3 = 53, 32, 33, 52, 13, 44, 32
$DataNames1 = 'South Korea', 'Canada', 'United Kingdom', 'Netherlands', 'Italy', 'France', 'Japan', 'United States', 'China', 'Germany'
Chart {
ChartBarOptions -Type barStacked
ChartLegend -Name 'People', 'Pets', 'Furniture'
for ($i = 0; $i -lt $Data1.Count; $i++) {
ChartBar -Name $DataNames1[$i] -Value $Data1[$i], $Data2[$i], $Data3[$i]
}
}
}
Panel {
$DataNames1 = 2001, 2002, 2003, 2004, 2005, 2006, 2007
Chart -Title 'Pets vs People' -TitleAlignment center {
ChartBarOptions -Type barStacked
ChartLegend -Name 'People', 'Pets'
ChartBar -Name $DataNames1[0] -Value 44, 53
ChartBar -Name $DataNames1[1] -Value 55, 32
ChartBar -Name $DataNames1[2] -Value 41, 33
ChartBar -Name $DataNames1[3] -Value 64, 52
ChartBar -Name $DataNames1[4] -Value 22, 13
ChartBar -Name $DataNames1[5] -Value 43, 44
ChartBar -Name $DataNames1[6] -Value 21, 32
}
}
}
}
Tab -Name 'Bar Charts - Bar Stacked 100%' -IconSolid audio-description {
Section -Name 'Bar Charts - Stacked 100%' -Collapsable {
Panel {
$Data1 = 44, 55, 41, 37, 22, 43, 21
$Data2 = 53, 32, 33, 52, 13, 43, 32
$Data3 = 12, 17, 11, 9, 15, 11, 20
$Data4 = 9, 7, 5, 8, 6, 9, 4
$Data5 = 25, 12, 19, 32, 25, 24, 10
$DataNames1 = 2008, 2009, 2010, 2011, 2012, 2013, 2014
Chart -Title 'Finctional Books Sales' {
ChartBarOptions -Type barStacked100Percent
ChartLegend -Names 'Marine Sprite', 'Striking Calf', 'Tank Picture', 'Tank Picture', 'Bucket Slope', 'Reborn Kid', 'Other' -LegendPosition top
for ($i = 0; $i -lt $Data1.Count; $i++) {
ChartBar -Name $DataNames1[$i] -Value $Data1[$i], $Data2[$i], $Data3[$i], $Data4[$i], $Data5[$i]
}
}
}
Panel {
$Data1 = 44, 55, 41, 64, 22, 43, 21
$Data2 = 53, 32, 33, 52, 13, 44, 32
$DataNames1 = 2001, 2002, 2003, 2004, 2005, 2006, 2007
Chart -Title 'Pets vs People' -TitleAlignment center {
ChartBarOptions -Type barStacked100Percent
ChartLegend -Names 'People', 'Pets' -LegendPosition bottom
for ($i = 0; $i -lt $Data1.Count; $i++) {
ChartBar -Name $DataNames1[$i] -Value $Data1[$i], $Data2[$i]
}
}
}
}
}
Tab -Name 'Bar Charts - Bar Stacked Plus/Minus' -IconRegular file {
Section -Name 'Bar Charts - Stacked 100%' -Collapsable {
Panel {
$Data1 = -0.8, -1.05, -1.06, -1.18, -1.4, -2.2, -2.85, -3.7, -3.96, -4.22, -4.3, -4.4, -4.1, -4, -4.1, -3.4, -3.1, -2.8
$Data2 = 0.4, 0.65, 0.76, 0.88, 1.5, 2.1, 2.9, 3.8, 3.9, 4.2, 4, 4.3, 4.1, 4.2, 4.5, 3.9, 3.5, 3
$DataLegend = 'Males', 'Females' # should match amount of data sets
$DataNames = '85+', '80-84', '75-79', '70-74', '65-69', '60-64', '55-59', '50-54', '45-49', '40-44', '35-39', '30-34', '25-29', '20-24', '15-19', '10-14', '5-9', '0-4'
Chart -Title 'Mauritius population pyramid 2011' {
ChartBarOptions -Type barStacked
ChartLegend -Names $DataLegend -LegendPosition top
for ($i = 0; $i -lt $Data1.Count; $i++) {
ChartBar -Name $DataNames[$i] -Value $Data1[$i], $Data2[$i]
}
}
#ChartBar -Data $Data1, $Data2 -DataNames $DataNames -DataLegend $DataLegend -Type barStacked -DataLabelsEnabled $true -Height 500
}
Panel {
$Data1 = -0.8, -1.05, -1.06, -1.18, -1.4, -2.2, -2.85, -3.7, -3.96, -4.22, -4.3, -4.4, -4.1, -4, -4.1, -3.4, -3.1, -2.8
$Data2 = 0.4, 0.65, 0.76, 0.88, 1.5, 2.1, 2.9, 3.8, 3.9, 4.2, 4, 4.3, 4.1, 4.2, 4.5, 3.9, 3.5, 3
$DataLegend = 'Males', 'Females' # should match amount of data sets
$DataNames = '85+', '80-84', '75-79', '70-74', '65-69', '60-64', '55-59', '50-54', '45-49', '40-44', '35-39', '30-34', '25-29', '20-24', '15-19', '10-14', '5-9', '0-4'
Chart -Title 'Mauritius population pyramid 2011' {
ChartBarOptions -Type barStacked -Vertical
ChartLegend -Names $DataLegend -LegendPosition top
for ($i = 0; $i -lt $Data1.Count; $i++) {
ChartBar -Name $DataNames[$i] -Value $Data1[$i], $Data2[$i]
}
}
}
}
}
Tab -Name 'Line Charts' -IconRegular hourglass {
Section -Name 'Line Charts - Test' -Collapsable {
Panel {
Chart -Title 'Incidents Reported vs Solved' -TitleAlignment center {
ChartAxisX -Name 'Jan', 'Feb', 'Mar', 'Apr', 'May', 'Jun', 'Jul', 'Aug', 'Sep'
ChartLine -Name 'Incidents per month' -Value 10, 41, 35, 51, 49, 62, 69, 91, 148
ChartLine -Name 'Incidents per month resolved' -Value 5, 10, 20, 31, 49, 62, 69, 91, 148
}
}
Panel {
Chart -Title 'Incidents Reported vs Solved' -TitleAlignment center {
ChartAxisX -Name 'Jan', 'Feb', 'Mar', 'Apr', 'May', 'Jun', 'Jul', 'Aug', 'Sep'
ChartLine -Name 'Incidents per month' -Value 10, 41, 35, 51, 49, 62, 69, 91, 148 -Color Red -Cap square -Dash 5
ChartLine -Name 'Incidents per month resolved' -Value 5, 10, 20, 31, 49, 62, 69, 91, 148 -Color Green -Curve stepline -Width 10
}
}
}
Section -Name 'Line Charts - Test' -Collapsable {
Panel {
Chart -Title 'Product Trends by Month' -TitleAlignment center {
ChartAxisX -Name 'Jan', 'Feb', 'Mar', 'Apr', 'May', 'Jun', 'Jul', 'Aug', 'Sep'
ChartLine -Name 'Desktop' -Value 10, 41, 35, 51, 49, 62, 69, 91, 148
}
}
Panel {
Chart -Title 'Average High & Low Temperature' -TitleAlignment left {
ChartAxisX -Name 'Jan', 'Feb', 'Mar', 'Apr', 'May', 'Jun', 'Jul'
ChartLine -Name "High - 2013" -Value 28, 29, 33, 36, 32, 32, 33 #-Color Red -Cap square -Dash 5
ChartLine -Name "Low - 2013" -Value 12, 11, 14, 18, 17, 13, 13 #-Color Green -Curve stepline -Width 10
}
}
}
Section -Name 'Line Charts - Test' -Collapsable {
Panel {
Chart -Title 'Product Trends by Month' -TitleAlignment center {
ChartAxisX -Name 'Jan', 'Feb', 'Mar', 'Apr', 'May', 'Jun', 'Jul', 'Aug', 'Sep'
ChartLine -Name 'Desktop' -Value 10, 41, 35, 51, 49, 62, 69, 91, 148
}
}
Panel {
Chart -Title 'Average High & Low Temperature' -TitleAlignment left {
ChartAxisX -Name 'Jan', 'Feb', 'Mar', 'Apr', 'May', 'Jun', 'Jul'
ChartLine -Name "High - 2013" -Value 28, 29, 33, 36, 32, 32, 33 -Color Red -Cap square -Dash 5
ChartLine -Name "Low - 2013" -Value 12, 11, 14, 18, 17, 13, 13 -Color BlueViolet
}
}
}
Section -Name 'Line Charts - Test' -Collapsable {
Panel {
Chart -Title 'Product Trends by Month' -TitleAlignment center {
ChartAxisX -Name 'Jan', 'Feb', 'Mar', 'Apr', 'May', 'Jun', 'Jul', 'Aug', 'Sep'
ChartLine -Name 'Desktop' -Value 10, 41, 35, 51, 49, 62, 69, 91, 148 -Curve stepline -Width 10
}
}
Panel -BackgroundColor Yellow {
Chart -Title 'Average High & Low Temperature' -TitleAlignment left {
# This controls how the grid looks like
ChartGrid -Show -Position front -xAxisLinesShow -StrokeDash 5 -RowColors Aquamarine, DarkCyan
# This is category (responsible for values on axis X)
ChartAxisX -Name 'Jan', 'Feb', 'Mar', 'Apr', 'May', 'Jun', 'Jul' -TitleText 'Month'
ChartAxisY -TitleText 'Temperature' -Show -ShowAlways
# Data and control of data
ChartLine -Name "High - 2013" -Value 28, 29, 33, 36, 32, 32, 33 -Curve smooth #-Color Red -Cap square -Dash 5
ChartLine -Name "Low - 2013" -Value 12, 11, 14, 18, 17, 13, 13 -Curve smooth #-Color Green -Curve stepline -Width 10
}
}
}
}
Tab -Name 'Line Charts but Invisible' -IconBrands app-store {
Section -Invisible -Name 'Line Charts - Test' -Collapsable {
Panel -Invisible {
Chart -Title 'Incidents Reported vs Solved' -TitleAlignment center {
ChartAxisX -Name 'Jan', 'Feb', 'Mar', 'Apr', 'May', 'Jun', 'Jul', 'Aug', 'Sep'
ChartLine -Name 'Incidents per month' -Value 10, 41, 35, 51, 49, 62, 69, 91, 148
ChartLine -Name 'Incidents per month resolved' -Value 5, 10, 20, 31, 49, 62, 69, 91, 148
}
}
Panel -Invisible {
Chart -Title 'Incidents Reported vs Solved' -TitleAlignment center {
ChartAxisX -Name 'Jan', 'Feb', 'Mar', 'Apr', 'May', 'Jun', 'Jul', 'Aug', 'Sep'
ChartLine -Name 'Incidents per month' -Value 10, 41, 35, 51, 49, 62, 69, 91, 148 -Color Red -Cap square -Dash 5
ChartLine -Name 'Incidents per month resolved' -Value 5, 10, 20, 31, 49, 62, 69, 91, 148 -Color Green -Curve stepline -Width 10
}
}
}
Section -Invisible -Name 'Line Charts - Test' -Collapsable {
Panel -Invisible {
Chart -Title 'Product Trends by Month' -TitleAlignment center {
ChartAxisX -Name 'Jan', 'Feb', 'Mar', 'Apr', 'May', 'Jun', 'Jul', 'Aug', 'Sep'
ChartLine -Name 'Desktop' -Value 10, 41, 35, 51, 49, 62, 69, 91, 148
}
}
Panel -Invisible {
Chart -Title 'Average High & Low Temperature' -TitleAlignment left {
ChartAxisX -Name 'Jan', 'Feb', 'Mar', 'Apr', 'May', 'Jun', 'Jul'
ChartLine -Name "High - 2013" -Value 28, 29, 33, 36, 32, 32, 33 #-Color Red -Cap square -Dash 5
ChartLine -Name "Low - 2013" -Value 12, 11, 14, 18, 17, 13, 13 #-Color Green -Curve stepline -Width 10
}
}
}
Section -Invisible -Name 'Line Charts - Test' -Collapsable {
Panel -Invisible {
Chart -Title 'Product Trends by Month' -TitleAlignment center {
ChartAxisX -Name 'Jan', 'Feb', 'Mar', 'Apr', 'May', 'Jun', 'Jul', 'Aug', 'Sep'
ChartLine -Name 'Desktop' -Value 10, 41, 35, 51, 49, 62, 69, 91, 148
}
}
Panel -Invisible {
Chart -Title 'Average High & Low Temperature' -TitleAlignment left {
ChartAxisX -Name 'Jan', 'Feb', 'Mar', 'Apr', 'May', 'Jun', 'Jul'
ChartLine -Name "High - 2013" -Value 28, 29, 33, 36, 32, 32, 33 -Color Red -Cap square -Dash 5
ChartLine -Name "Low - 2013" -Value 12, 11, 14, 18, 17, 13, 13 -Color BlueViolet
}
}
}
Section -Invisible -Name 'Line Charts - Test' -Collapsable {
Panel -Invisible {
Chart -Title 'Product Trends by Month' -TitleAlignment center {
ChartAxisX -Name 'Jan', 'Feb', 'Mar', 'Apr', 'May', 'Jun', 'Jul', 'Aug', 'Sep'
ChartLine -Name 'Desktop' -Value 10, 41, 35, 51, 49, 62, 69, 91, 148 -Curve stepline -Width 10
}
}
Panel -Invisible -BackgroundColor Yellow {
Chart -Title 'Average High & Low Temperature' -TitleAlignment left {
# This controls how the grid looks like
ChartGrid -Show -Position front -xAxisLinesShow -StrokeDash 5 -RowColors Aquamarine, DarkCyan
# This is category (responsible for values on axis X)
ChartAxisX -Name 'Jan', 'Feb', 'Mar', 'Apr', 'May', 'Jun', 'Jul' -TitleText 'Month'
ChartAxisY -TitleText 'Temperature' -Show -ShowAlways
# Data and control of data
ChartLine -Name "High - 2013" -Value 28, 29, 33, 36, 32, 32, 33 -Curve smooth #-Color Red -Cap square -Dash 5
ChartLine -Name "Low - 2013" -Value 12, 11, 14, 18, 17, 13, 13 -Curve smooth #-Color Green -Curve stepline -Width 10
}
}
}
}
} -Show
💡 I don't want to use Dashimo! I want direct calls, show me PSWriteHTML
If for some reason your decision will be to use PSWriteHTML (I do use it in some of my projects) directly here's how you can create Bar Charts in PSWriteHTML. You can also explore other examples on GitHub.
Import-Module .\PSWriteHTML.psd1 -Force

New-HTML -TitleText 'My title' -UseCssLinks:$true -UseJavaScriptLinks:$true -FilePath $PSScriptRoot\Example-ChartsBar.html {
    New-HTMLTabOptions -SlimTabs
    New-HTMLTab -Name 'Bar Charts - Bar' -IconRegular chart-bar {
        New-HTMLSection -HeaderText 'Bar Charts - Test' -CanCollapse {
            New-HTMLPanel {
                New-HTMLChart {
                    New-ChartBar -Name 'Test' -Value 1
                    New-ChartBar -Name 'Test1' -Value 2
                    New-ChartBar -Name 'Test2' -Value 3
                }
            }
            New-HTMLPanel {
                New-HTMLChart {
                    New-ChartToolbar -Download
                    New-ChartLegend -Name 'Time', 'Money', 'Taxes'
                    New-ChartBar -Name 'Test' -Value 1, 2, 3
                    New-ChartBar -Name 'Test1' -Value 2, 5, 7
                    New-ChartBar -Name 'Test2' -Value 3, 1, 2
                }
            }
            New-HTMLPanel {
                New-HTMLChart {
                    New-ChartLegend -Name 'Time'
                    for ($i = 0; $i -le 5; $i++) {
                        New-ChartBar -Name "Test $i" -Value $i
                    }
                }
            }
            New-HTMLPanel {
                New-HTMLChart {
                    New-ChartBarOptions -Vertical -DataLabelsColor GreenYellow
                    New-ChartLegend -Name 'Time'
                    for ($i = 0; $i -le 5; $i++) {
                        New-ChartBar -Name "Test $i" -Value $i
                    }
                }
            }
        }
        New-HTMLSection -HeaderText 'Bar Charts - Test Colors' -CanCollapse {
            New-HTMLPanel -Invisible {
                New-HTMLChart {
                    New-ChartLegend -Name 'Time'
                    New-ChartBar -Name 'Test' -Value 1
                    New-ChartBar -Name 'Test1' -Value 2
                    New-ChartBar -Name 'Test2' -Value 3
                }
            }
            New-HTMLPanel -Invisible {
                New-HTMLChart {
                    New-ChartLegend -Name 'Time', 'Money', 'Taxes'
                    New-ChartBar -Name 'Test' -Value 1, 2, 3
                    New-ChartBar -Name 'Test1' -Value 2, 5, 7
                    New-ChartBar -Name 'Test2' -Value 3, 1, 2
                }
            }
            New-HTMLPanel -Invisible {
                New-HTMLChart {
                    New-ChartLegend -Name 'Time'
                    for ($i = 0; $i -le 5; $i++) {
                        New-ChartBar -Name "Test $i" -Value $i
                    }
                }
            }
            New-HTMLPanel -Invisible {
                New-HTMLChart {
                    New-ChartBarOptions -Vertical -DataLabelsColor GreenYellow
                    New-ChartLegend -Name 'Time'
                    for ($i = 0; $i -le 5; $i++) {
                        New-ChartBar -Name "Test $i" -Value $i
                    }
                }
            }
        }
        New-HTMLSection -HeaderText 'Bar Charts - Standard Bar' -CanCollapse {

            New-HTMLPanel {
                $Data1 = 400, 430, 448, 470, 540, 580, 690, 1100, 1200, 1380
                $DataNames1 = 'South Korea', 'Canada', 'United Kingdom', 'Netherlands', 'Italy', 'France', 'Japan', 'United States', 'China', 'Germany'
                New-HTMLChart {
                    New-ChartLegend -Name 'Number of bottles'
                    for ($i = 0; $i -lt $Data1.Count; $i++) {
                        New-ChartBar -Name $DataNames1[$i] -Value $Data1[$i]
                    }
                }
            }

            New-HTMLPanel {
                $Data1 = 44, 55, 41, 64, 22, 43, 21
                $Data2 = 53, 32, 33, 52, 13, 44, 32
                $DataNames1 = 2001, 2002, 2003, 2004, 2005, 2006, 2007

                New-HTMLChart -Title 'Born vs Dead' -TitleAlignment center {
                    #New-ChartBarOptions
                    New-ChartLegend -Name 'Born', 'Died'
                    for ($i = 0; $i -lt $Data1.Count; $i++) {
                        New-ChartBar -Name $DataNames1[$i] -Value $Data1[$i], $Data2[$i]
                    }
                }
            }
        }
        New-HTMLSection -HeaderText 'Bar Charts - Standard Bar Vertical' -CanCollapse {

            New-HTMLPanel {
                $Data1 = 400, 430, 448, 470, 540, 580, 690, 1100, 1200, 1380
                $DataNames1 = 'South Korea', 'Canada', 'United Kingdom', 'Netherlands', 'Italy', 'France', 'Japan', 'United States', 'China', 'Germany'
                New-HTMLChart {
                    New-ChartBarOptions -Vertical
                    New-ChartLegend -Name 'Number of bottles'
                    for ($i = 0; $i -lt $Data1.Count; $i++) {
                        New-ChartBar -Name $DataNames1[$i] -Value $Data1[$i]
                    }
                }
            }

            New-HTMLPanel {
                $Data1 = 44, 55, 41, 64, 22, 43, 21
                $Data2 = 53, 32, 33, 52, 13, 44, 32
                $DataNames1 = 2001, 2002, 2003, 2004, 2005, 2006, 2007

                New-HTMLChart -Title 'Born vs Dead' -TitleAlignment center {
                    New-ChartBarOptions -Vertical
                    New-ChartLegend -Name 'Born', 'Died'
                    for ($i = 0; $i -lt $Data1.Count; $i++) {
                        New-ChartBar -Name $DataNames1[$i] -Value $Data1[$i], $Data2[$i]
                    }
                }
            }
        }
        New-HTMLSection -HeaderText 'Bar Charts - Standard Bar Vertical & Patterned' -CanCollapse {

            New-HTMLPanel {
                $Data1 = 400, 430, 448, 470, 540, 580, 690, 1100, 1200, 1380
                $DataNames1 = 'South Korea', 'Canada', 'United Kingdom', 'Netherlands', 'Italy', 'France', 'Japan', 'United States', 'China', 'Germany'
                New-HTMLChart {
                    New-ChartBarOptions -Vertical -Patterned
                    New-ChartLegend -Name 'Number of bottles'
                    for ($i = 0; $i -lt $Data1.Count; $i++) {
                        New-ChartBar -Name $DataNames1[$i] -Value $Data1[$i]
                    }
                }
            }

            New-HTMLPanel {
                $Data1 = 44, 55, 41, 64, 22, 43, 21
                $Data2 = 53, 32, 33, 52, 13, 44, 32
                $DataNames1 = 2001, 2002, 2003, 2004, 2005, 2006, 2007

                New-HTMLChart -Title 'Born vs Dead' -TitleAlignment center {
                    New-ChartBarOptions -Vertical -Patterned
                    New-ChartLegend -Name 'Born', 'Died'
                    for ($i = 0; $i -lt $Data1.Count; $i++) {
                        New-ChartBar -Name $DataNames1[$i] -Value $Data1[$i], $Data2[$i]
                    }
                }
            }
        }
    }
    New-HTMLTab -Name 'Bar Charts - Bar Stacked' -IconRegular chart-bar {

        New-HTMLSection -HeaderText 'Bar Charts 1 - Bar Stacked' -CanCollapse {
            # One way to build charts but with 2 values
            New-HTMLPanel {
                $Data1 = 400, 430, 448, 470, 540, 580, 690, 1100, 1200, 1380
                $Data2 = 44, 55, 41, 64, 22, 43, 21
                $Data3 = 53, 32, 33, 52, 13, 44, 32
                $DataNames1 = 'South Korea', 'Canada', 'United Kingdom', 'Netherlands', 'Italy', 'France', 'Japan', 'United States', 'China', 'Germany'

                New-HTMLChart {
                    New-ChartBarOptions -Type barStacked
                    New-ChartLegend -Name 'People', 'Pets', 'Furniture'
                    for ($i = 0; $i -lt $Data1.Count; $i++) {
                        New-ChartBar -Name $DataNames1[$i] -Value $Data1[$i], $Data2[$i], $Data3[$i]
                    }
                }
            }
            New-HTMLPanel {
                $DataNames1 = 2001, 2002, 2003, 2004, 2005, 2006, 2007
                New-HTMLChart -Title 'Pets vs People' -TitleAlignment center {
                    New-ChartBarOptions -Type barStacked
                    New-ChartLegend -Name 'People', 'Pets'
                    New-ChartBar -Name $DataNames1[0] -Value 44, 53
                    New-ChartBar -Name $DataNames1[1] -Value 55, 32
                    New-ChartBar -Name $DataNames1[2] -Value 41, 33
                    New-ChartBar -Name $DataNames1[3] -Value 64, 52
                    New-ChartBar -Name $DataNames1[4] -Value 22, 13
                    New-ChartBar -Name $DataNames1[5] -Value 43, 44
                    New-ChartBar -Name $DataNames1[6] -Value 21, 32
                }
            }
        }
    }
    New-HTMLTab -Name 'Bar Charts - Bar Stacked 100%' -IconSolid audio-description {
        New-HTMLSection -HeaderText 'Bar Charts - Stacked 100%' -CanCollapse {
            New-HTMLPanel {
                $Data1 = 44, 55, 41, 37, 22, 43, 21
                $Data2 = 53, 32, 33, 52, 13, 43, 32
                $Data3 = 12, 17, 11, 9, 15, 11, 20
                $Data4 = 9, 7, 5, 8, 6, 9, 4
                $Data5 = 25, 12, 19, 32, 25, 24, 10
                $DataNames1 = 2008, 2009, 2010, 2011, 2012, 2013, 2014
                New-HTMLChart -Title 'Finctional Books Sales' {
                    New-ChartBarOptions -Type barStacked100Percent
                    New-ChartLegend -Names 'Marine Sprite', 'Striking Calf', 'Tank Picture', 'Tank Picture', 'Bucket Slope', 'Reborn Kid', 'Other' -LegendPosition top
                    for ($i = 0; $i -lt $Data1.Count; $i++) {
                        New-ChartBar -Name $DataNames1[$i] -Value $Data1[$i], $Data2[$i], $Data3[$i], $Data4[$i], $Data5[$i]
                    }
                }
            }
            New-HTMLPanel {
                $Data1 = 44, 55, 41, 64, 22, 43, 21
                $Data2 = 53, 32, 33, 52, 13, 44, 32
                $DataNames1 = 2001, 2002, 2003, 2004, 2005, 2006, 2007
                New-HTMLChart -Title 'Pets vs People' -TitleAlignment center {
                    New-ChartBarOptions -Type barStacked100Percent
                    New-ChartLegend -Names 'People', 'Pets' -LegendPosition bottom
                    for ($i = 0; $i -lt $Data1.Count; $i++) {
                        New-ChartBar -Name $DataNames1[$i] -Value $Data1[$i], $Data2[$i]
                    }
                }
            }
        }
    }
    New-HTMLTab -Name 'Bar Charts - Bar Stacked Plus/Minus' -IconRegular file {
        New-HTMLSection -HeaderText 'Bar Charts - Stacked 100%' -CanCollapse {
            New-HTMLPanel {
                $Data1 = -0.8, -1.05, -1.06, -1.18, -1.4, -2.2, -2.85, -3.7, -3.96, -4.22, -4.3, -4.4, -4.1, -4, -4.1, -3.4, -3.1, -2.8
                $Data2 = 0.4, 0.65, 0.76, 0.88, 1.5, 2.1, 2.9, 3.8, 3.9, 4.2, 4, 4.3, 4.1, 4.2, 4.5, 3.9, 3.5, 3
                $DataLegend = 'Males', 'Females' # should match amount of data sets
                $DataNames = '85+', '80-84', '75-79', '70-74', '65-69', '60-64', '55-59', '50-54', '45-49', '40-44', '35-39', '30-34', '25-29', '20-24', '15-19', '10-14', '5-9', '0-4'

                New-HTMLChart -Title 'Mauritius population pyramid 2011' {
                    New-ChartBarOptions -Type barStacked
                    New-ChartLegend -Names $DataLegend -LegendPosition top
                    for ($i = 0; $i -lt $Data1.Count; $i++) {
                        New-ChartBar -Name $DataNames[$i] -Value $Data1[$i], $Data2[$i]
                    }
                }
            }
            New-HTMLPanel {
                $Data1 = -0.8, -1.05, -1.06, -1.18, -1.4, -2.2, -2.85, -3.7, -3.96, -4.22, -4.3, -4.4, -4.1, -4, -4.1, -3.4, -3.1, -2.8
                $Data2 = 0.4, 0.65, 0.76, 0.88, 1.5, 2.1, 2.9, 3.8, 3.9, 4.2, 4, 4.3, 4.1, 4.2, 4.5, 3.9, 3.5, 3
                $DataLegend = 'Males', 'Females' # should match amount of data sets
                $DataNames = '85+', '80-84', '75-79', '70-74', '65-69', '60-64', '55-59', '50-54', '45-49', '40-44', '35-39', '30-34', '25-29', '20-24', '15-19', '10-14', '5-9', '0-4'

                New-HTMLChart -Title 'Mauritius population pyramid 2011' {
                    New-ChartBarOptions -Type barStacked -Vertical
                    New-ChartLegend -Names $DataLegend -LegendPosition top
                    for ($i = 0; $i -lt $Data1.Count; $i++) {
                        New-ChartBar -Name $DataNames[$i] -Value $Data1[$i], $Data2[$i]
                    }
                }
            }
        }
    }
} -Show
If you use this and do something nice with it – let me know. I like seeing what people come up with. Also, if you see something that doesn't work, something that needs fixing or something I'm using incorrectly let me know. You're most welcome to do Pull Requests to help out with development or documentation or make your pick.
💡 Dashimo – How to Install
So you know how to use Dashimo? You use Install-Module PowerShell command. This will install the module from PowerShellGallery hosted by Microsoft. Why would you do it, instead of using sources? Because I publish a new version, fixes directly to it, and 5 minutes later you can have an updated version up and running. Also versions I publish to PSGallery are optimized for speed and remove any “junk” from source code. It's much faster that way. If you can't use PowerShellGallery, you should consider downloading stuff directly from there and using “published version.” I do commit to master directly on GitHub so you may have some weird stuff you take my release in the middle of the release cycle 🙂
Install-Module Dashimo -Force -AllowClobber
That's it. Notice how I'm using Force. I use force because it redownloads Dashimo but also any required modules. You see when I update Dashimo, I often update PSWriteHTML and PSSharedGoods. This makes sure all three modules are up to date. However, you can also use Update-Module, and it should work as well. Up to you, really! The important thing is if something works for you on production, keep using it till you test the new version on a test computer. I do changes that may not be big, but big enough that auto-update will break your code. For example, small rename to a parameter and your code stops working! Be responsible!